GeoHECRAS Update: 3D River Geometry Interpolation and more

Dec 28, 2016 Release
For this release of GeoHECRAS, after getting lots of feedback from our users, we have introduced several major new features that improve and speedup the workflow of the HEC-RAS modeler. For example, the software will automatically interpolate the 3D river geometry from the defined HEC-RAS cross-sections and provided ground terrain data. This command goes far beyond the existing U.S. Army Corps of Engineers HEC-RAS’ Interpolate Cross Sections command by not only interpolating cross sections but interpolating the 3D river geometry between defined cross sections.
In addition, LIDAR processing, 3D elevation data for buildings throughout the world, unsteady flow floodplain encroachments, batch plotting of cross sections to CAD, HEC-2 model import, and many more features have been added.
Take a look at all of the new functionality that has been added.
What’s New
Crop Base Map Command
The Crop Base Map command will crop the base map to the elevation terrain data extents. The base map will not extend outside of the elevation terrain data limits.
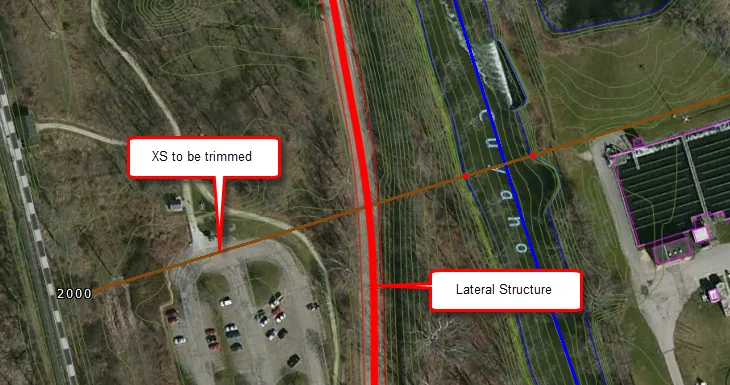
Automatic Trimming & Extending of Cross Sections while Defining Levees
While defining levees using either the Assign Levees or Draw Levees command, the software will automatically trim and extend the adjacent cross-sections to align with the constructed levee.
Data Explorer Panel Resizing
The Data Explorer panel now allows the user to resize the height of the panel. This allows the user to see more information at one time.
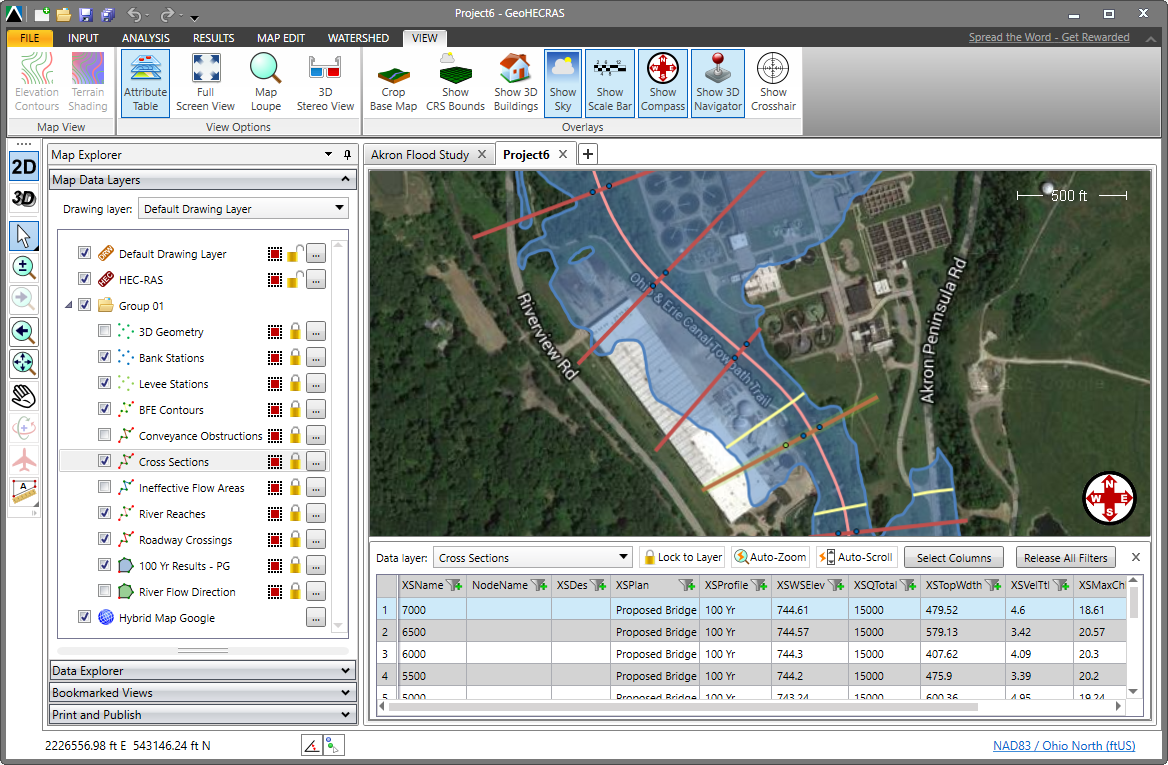
Attribute Table
The Attribute Table allows the user to easily review and edit HEC-RAS, GIS and other spatial attribute data. The Attribute Table can be used to filter, sort and highlight specific geospatial elements on the Map View. When changes are made to the attribute data, the changes are dynamically updated on the Map View.
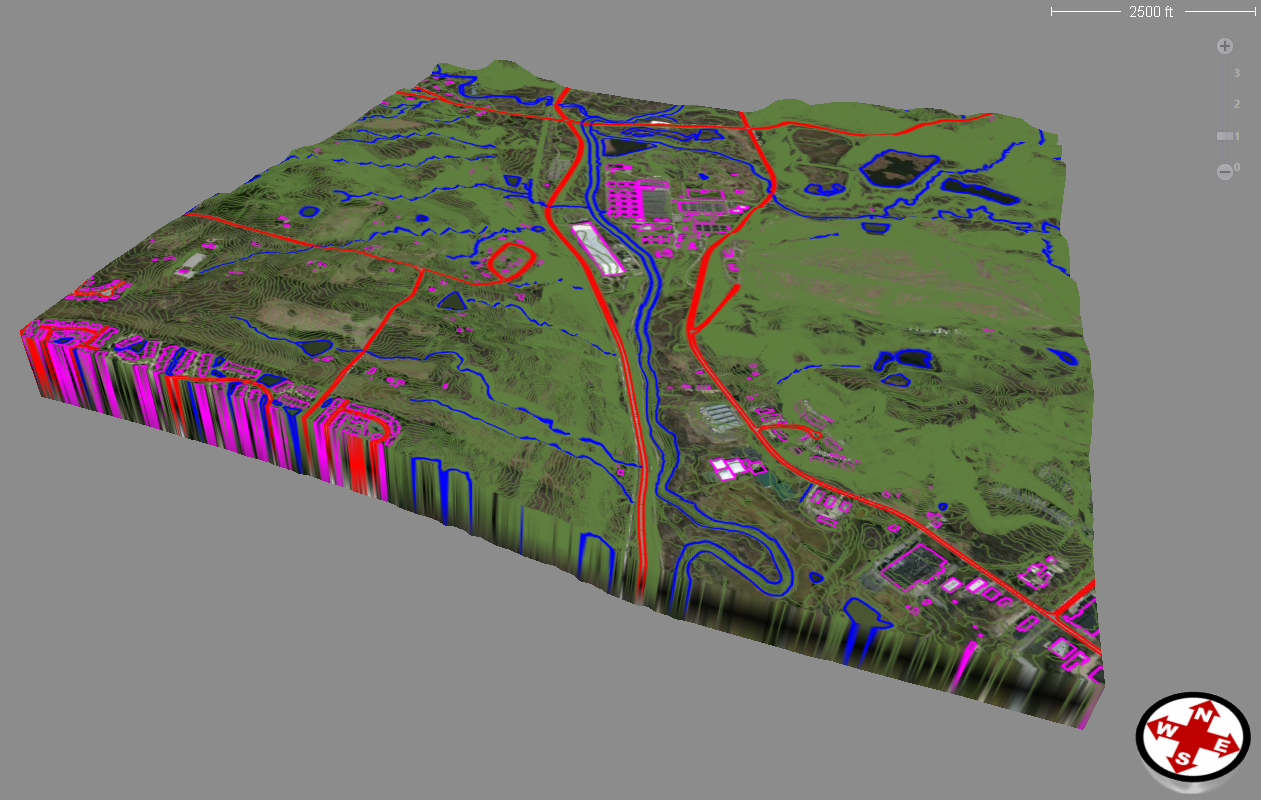
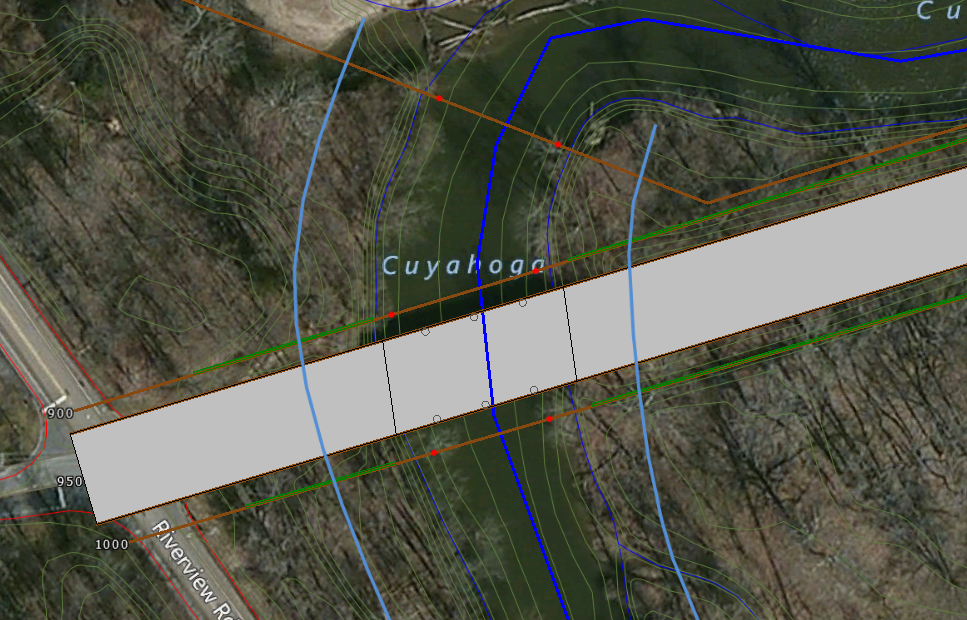
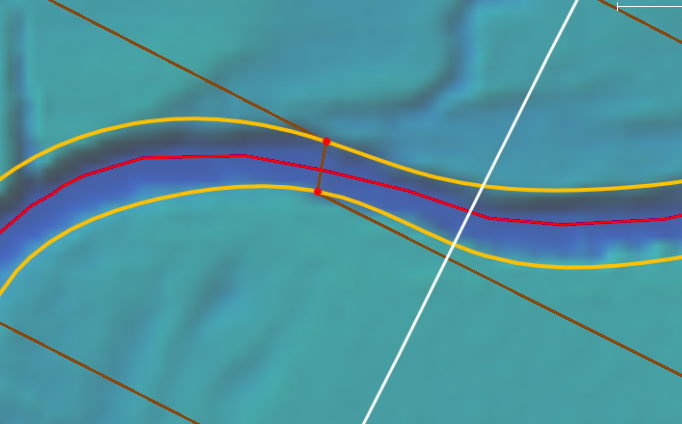
Interpolate River Geometry Command
The Interpolate River Geometry command allows the user to interpolate the 3D river geometry from the defined HEC-RAS cross-sections and provided ground terrain data. This command goes far beyond the existing U.S. Army Corps of Engineers HEC-RAS’ Interpolate Cross Sections command by not only interpolating cross sections but interpolating the 3D river geometry between defined cross sections. This is quite useful when the terrain data does not contain any channel geometry. From the defined HEC-RAS cross sections, the software will interpolate the river channel geometry between the defined cross sections by burning the cross section channel geometry into the 3D terrain data.
LIDAR Processing
The Process LIDAR command provides numerous advanced LIDAR processing tools, including point cloud classification filtering, extraction of buildings and other structures, dramatically faster surface generation, and much more.
- Processing of point cloud files
- Advanced filtering options to efficiently remove erroneous or unneeded points
- Merging multiple LIDAR data sets
- Trimming LIDAR data
- Thinning LIDAR data
We have been able to successfully process a 12 gigabyte LAS file with over 460,000,000 points.
Multiple HEC-RAS Versions Supported
The software allows the user to define which HEC-RAS version should be used for the analysis computations. The following HEC-RAS versions are provided:
- HEC-RAS 5.0.3 (2D elements not yet supported)
- HEC-RAS 4.1.0
- HEC-RAS 3.1.3 (steady flow only)
- HEC-RAS 3.0.1 (steady flow only)
Note that 2D element flow modeling that is provided in Version 5.0 of HEC-RAS is not yet supported, but will be in an upcoming future version.
Assignment of HEC-RAS Flow Data by GIS Node Shapefiles
HEC-RAS flow data can be assigned by GIS node shapefiles. This allows the user to import stormwater hydrology GIS data, such as HEC-HMS result data, and have it automatically assigned to the appropriate river reach, and internal cross sections if available. In addition, the software will assign normal depth condition to the model’s downstream boundary.
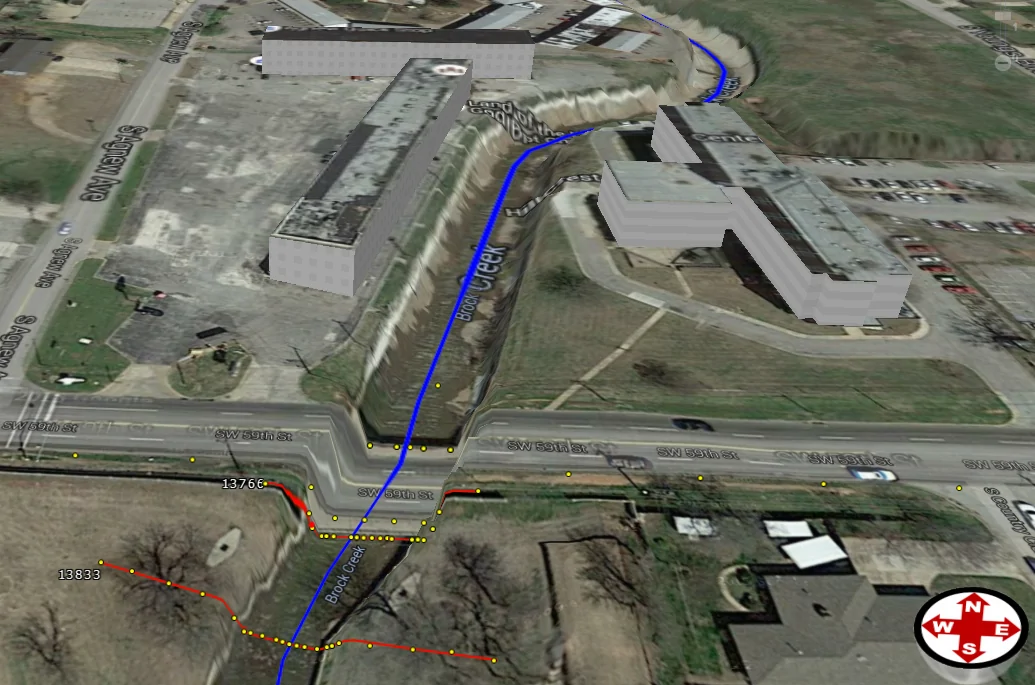
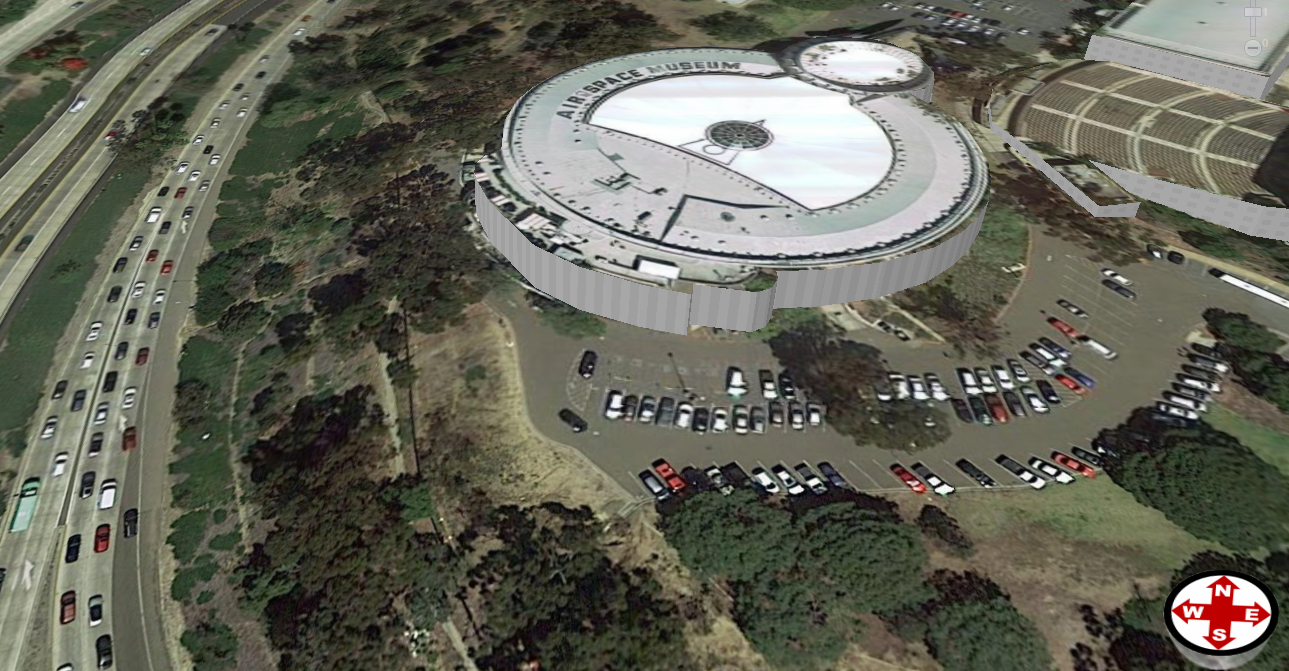
Construct 3-D Buildings from OSM Data
Open Street Maps (OSM) provides 3-D elevation data for buildings throughout the world. The Show 3D Buildings command will retrieve this information from OSM and construct realistic 3-D buildings on the Map View.
Display Lateral Structure on Profile Plot
The software now displays lateral structures in the profile plot.
Plot Results in Inline Structure Data dialog box
The software now displays the water surface profile results on the inline structure plot contained within the Inline Structure Data dialog box.
Plot Results in Lateral Structure Data dialog box
The software now displays the water surface profile results on the lateral structure plot contained within the Lateral Structure Data dialog box.
Culverts, Piers and Abutments shown on 2D Roadway Crossing
While in 2D View Mode, the software will display the location of culverts, bridge piers, bridge abutments on the roadway crossing structure so that it is easier to identify the location of these structure elements. Selection of bridge piers and culvert centerline stationing are referenced on the upstream and downstream face of the roadway structure, rather than on the adjacent cross sections. This makes it much easier for the user to properly locate these elements.
Unsteady Flow Floodplain Encroachments
Complete support for the US Army Corps of Engineers HEC-RAS unsteady flow floodplain encroachments have been added to the software. Included with this support are performance enhancements to make the engineer more productive, similar to the Steady Flow Floodplain Encroachments command already in the software.
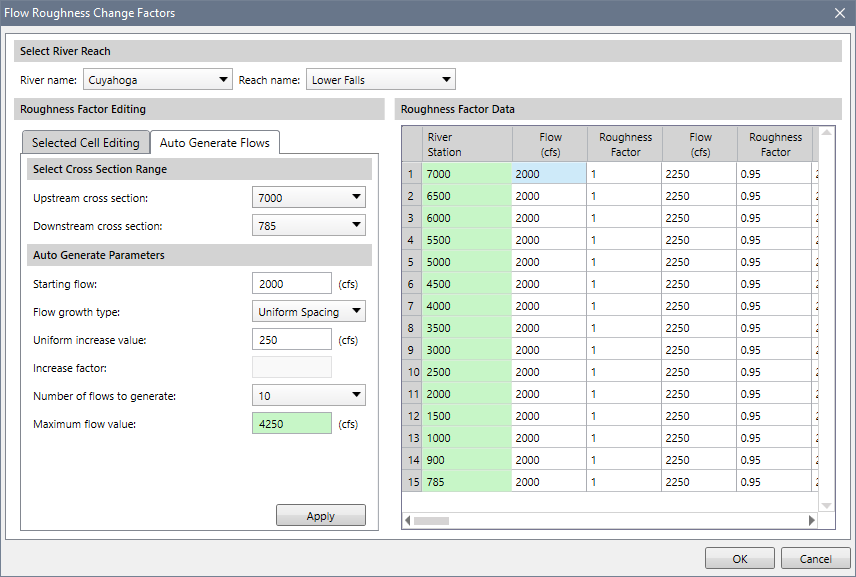
Flow Roughness Change Factors
The Flow Roughness Change Factors dialog box allows the modeler to adjust roughness coefficients with changes in flow. This feature is very useful for calibrating an unsteady flow model for flows that range from low to high. Roughness generally decreases with increases in flow and depth. For example, for shallow, lower flows the Manning’s roughness can be increased to a higher value, but for deep, higher flows the Manning’s roughness will be reduced to a lower value. This is especially true on large river systems. This feature allows the user to adjust roughness coefficients up or down in order to calibrate the model to observed data.
Pump Station Elements
Complete support of pump stations for unsteady flow modelling has been added. A pump station can be used to pump water between two storage areas, a storage area and a river reach, or between two river reaches. Each pump station can have up to 10 different pump groups, and each pump group can have up to 20 identical pumps. The defined pumps have a pump performance curve defined, which dictates the flow rate versus head differential that the pump will perform at. In addition, rules can be defined that describe when the pump will turn on and off based upon other conditions within the model.
Remember HEC-RAS Profile and Output Display Options
The software will now remember the selected profile and HEC-RAS output display options when displaying HEC-RAS output during a session. For example, iterating the analysis and then redisplaying the results can be time consuming. To speed that process up, when redisplaying a cross section plot, profile plot and other output plots, the software will use the same profile and display options as were in the prior iteration.
Flood Map Reach Selection
The Flood Map command allows the user to select an individual river reach when generating the flood map. When dealing with large models with numerous river reaches, the user may only want to work on a single reach or even a small portion of a river reach. The user can now select an individual reach for generating the flood map. In addition, if the underlying terrain model only occupies a portion of the river reach, the software will limit the extent of the generated flood map to limits of the terrain model, thereby vastly speeding up the flood map generation.
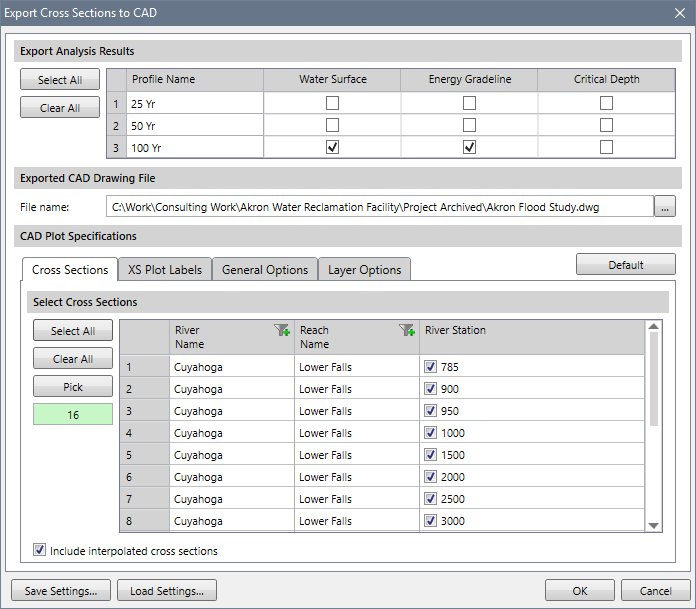
Export Cross Sections to CAD Command
The Export Cross Sections to CAD command is used to automate the batch plotting of all or a selection of cross sections to CAD (i.e., AutoCAD and MicroStation) in a rectangular array pattern. This allows the user to quickly generate cross section plot sheets for their clients. This command allows the defined settings to be saved, and the later retrieved, for specific plot requirements.
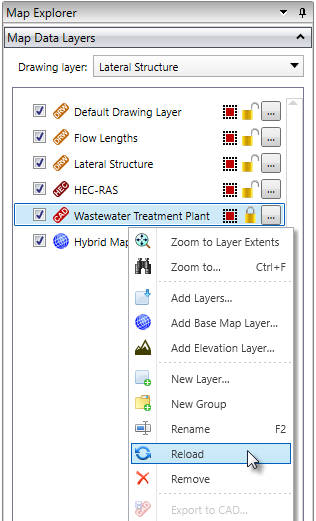
Reload Layer Command
The software now allows the user to reload a layer by right-clicking on the layer and selecting the Reload Layer command. For example, to reload an external AutoCAD drawing that has just changed, use the Reload Layer command. This prevents the user from having to unload the drawing and then reopening the new drawing. Similarly, if you have made changes to the HEC-RAS model external from GeoHECRAS using the US Army Corps HEC-RAS software, reloading the HEC-RAS model will cause those changes to be reflected in the HEC-RAS model contained within GeoHECRAS.
Note that any modified layer options, such as AutoCAD layer visibility, color changes, assigned coordinate reference system, and other options are retained for the newly reloaded layer.
Draw Cross Sections Command Shortcut (Ctrl+D Keypress)
Pressing Ctrl+D will automatically start the Draw Cross Sections command. This allows the user to quickly draw additional cross sections without having to interact with the ribbon menu or Draw Cross Sections dialog box. Pressing Ctrl+D the first time will directly run the Draw Cross Sections command, allowing the user to immediately start drawing the cross section on the Map View.
After completing the drawing of the cross section on the Map View, the user is returned to the Draw Cross Sections dialog box. Instead of having to click the [Apply] button and then the [Draw] button to start drawing the next cross section, the user can press Ctrl+D to accept the just drawn cross section and the immediately start drawing the next cross section on the Map View. Alternatively, the user can press Ctrl+D upon finishing the drawn cross section, rather than right-clicking and choosing Done from the displayed context menu, and the software will accept the drawn cross section and then immediately start drawing the next cross section.
Note that the Ctrl+D keypress is ignored when other commands are active, like when the Cross Section Data dialog box is displayed.
Floating Debris at Bridge Piers
Floating debris clusters can be added to bridge piers at the upstream face of the bridge. Debris clusters can be included at all piers or individual piers. Debris sizes can be defined for all piers or can vary for each pier. The debris cluster is centered on the pier and moves up and down with the water surface. It becomes fixed in place when it comes in contact with the bridge low chord at the pier centerline. A debris raft can be modeled by setting the debris width to form a continuous blockage.
Export Table from Bridge Opening Comparison
The user can now export the bridge opening comparison table from within the Bridge & Culvert Data dialog box to the clipboard, Microsoft Excel, and to a PDF file. This helps the user document the differences between two bridges, such as existing and proposed bridge openings.
Smart Cross Section Plot Legend Placement
The software will now automatically determine the best location for the legend on the cross section plot in the Cross Section Data dialog box, as well as for the roadway crossing plot in the Bridge & Culvert Data dialog box.
HEC-2 Model Import
The software can import HEC-2 models with the same import capabilities that the Army Corps of Engineers HEC-RAS software provides.
Exporting Bridges, Inline Structures, and Lateral Structures to AutoCAD and MicroStation
When exporting a HEC-RAS model to AutoCAD or MicroStation, bridges, inline structures, and lateral structures are exported as polyface meshes. This allows the user to render a photo realistic representation of the HEC-RAS project from the exported meshes.
CAD Drawing & TIN Surface Transformation Support
Surveyors use a NOAA online software program called OPUS that takes measured GPS grid coordinates from a survey data collector and convert them into local ground coordinates that are corrected for the true shape of the Earth (which is not a perfect sphere). AutoCAD Civil3D provides support for the transformation scale factor in its Drawing Settings dialog box. We have implemented support for this transformation scale factor in the CAD Properties and TIN Surface Properties dialog boxes, allowing the software to support local ground coordinates.
Imported AutoCAD Drawings Drawing Bounds
While importing an AutoCAD drawing, the software determines the drawing limits to the area contained within the coordinate reference system (CRS). For example, many times the drawings have data drawn near the origin (0, 0). When importing in an AutoCAD drawing, this can artificially extend the drawing bounds to an unrealistic area. While importing in AutoCAD drawing, the software will discard areas that are outside the coordinate limits of the project coordinate reference system.
External Flow Data Import
GIS node data can be assigned as flow data to a HEC-RAS model. Both external and internal boundary flow data can be assigned. The software will intelligently determine where the flow data should be assigned. In addition, the software will estimate the downstream boundary energy gradeline slope for assigning normal depth as a downstream boundary condition.
LIDAR Layer Properties Dialog Box
The display of LIDAR data can be controlled using the LIDAR layer properties dialog box. The user can specify that the LIDAR point data be colored based upon elevation. In addition, the point symbol (circle/square) and symbol size for the LIDAR data can be specified.
PDF Layer Properties Dialog Box
Loaded PDF files now have a layer properties dialog box. This dialog box includes detailed information on the loaded PDF file, including any metadata.
Convert Elevation Command
The Convert Elevation command allows elevation grids to be converted between different units of measure. For example, USGS elevation grids have horizontal units in feet but elevations commonly in meters. This command allows the user to quickly convert the elevations from meters to feet.
Additional Map Edit Commands
Additional GIS editing commands have been added to facilitate the user and manipulating map data. The following commands have been added:
Edit Polylines
- Buffer Polylines
- Split Polylines
- Merge Polylines
- Reshape Polyline
- Offset Polyline
Edit Polygons
- Build Polygons
- Buffer Polygons
- Split Polygons
- Merge Polygons
- Explode Multipart
- Reshape Polygon
- Fill Holes
Node Name Included in GIS Export
When exporting a HEC-RAS model to GIS shapefiles, defined node names are now included with cross sections, roadway crossings, and inline structures.
Drag-and-Drop HEC-RAS Models
In addition to other common file formats, the user can drag HEC-RAS project files (*.PRJ) onto the GeoHECRAS user interface and the software will automatically load them.
Copy Element Reference Point is Referenced to Cursor Location
When copying an element, such as a cross section, the cursor location is now considered when making the copy. This makes it more seamless for the user in placing the copied element on the Map View.
Delete Custom CRS
The software now allows deleting of any added custom coordinate reference system (CRS). Simply right-click on the CRS and choose Delete from the displayed context menu.
Measure Distance and Slope on Profile Plot
The user can now measure both distance and slope on the profile plot. This helps the user in estimating boundary condition energy slope values for the HEC-RAS model.
What’s Updated
Assign River Reaches
While selecting a river reach using the Assign River Reaches command, when the user selects the river reach, the software displays the assumed flow direction arrow directly on the river reach where the user clicked.
Extract Cross Section Geometry
The software will now only extract cross section geometry from an underlying elevation grid where there is valid elevation data. The software will automatically recognize the limits of the elevation data and extract cross section geometry where this data exists. It will not try to extract cross section geometry data where there is no valid elevation data.
For example, the underlying elevation grid might be of the river channel only. Previously, extracting the cross section geometry for this area required that the user define the channel bank stations at the limits of the elevation data and then extract cross section geometry only for the cross section channel. If the user tried to extract cross section geometry for the overbank areas, the overbank geometry would be flat.
Improved Merge DEMs Command
The Merge DEMs command has been enhanced to support merging DEMs that are different coordinate reference systems (CRS) and even different units. For example, the project might be in a State Plane CRS in US Survey Foot and the DEMs being merged might be in a geographic (lat-long) or metric CRS. The software will perform the necessary internal reprojections to align the selected DEMs so that they can merged together. In addition, the user can specify the CRS and grid resolution of the final merged DEM.
Elevation Grid Cross Section Cutting Method
The default elevation grid cross section cutting method has been changed from variable resolution to fixed resolution.
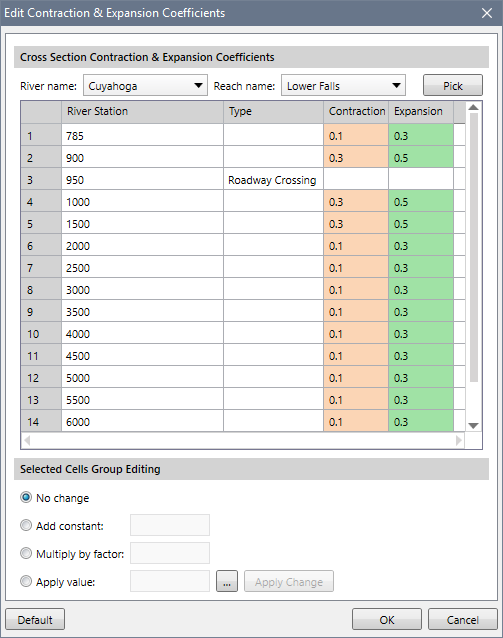
Expansion & Contraction Coefficients
The software will not automatically recognize internal structures, such as roadway crossings with bridges and culverts, and assign the appropriate expansion and contraction coefficients at the required cross sections. Clicking on the [Default] button will automatically assign these coefficients. In addition, the user can now pick the river reach of interest from the Map View for editing the expansion and contraction coefficients.
Downstream Cross Section River Station
The following commands have been modified so that the downstream most cross section’s river station can include the distance to a connecting downstream junction or downstream to the end of the river reach. In that way, the cross sections can incorporate the entire river reach length into the assignment of the defined river stations. In addition, the user can measure the downstream reach distance if a specific flow path should be incorporated into the downstream most cross section river station value.
- Assign Multiple Cross Sections
- Automated Draw Cross Sections
- Edit River Stations, Node Names & Descriptions
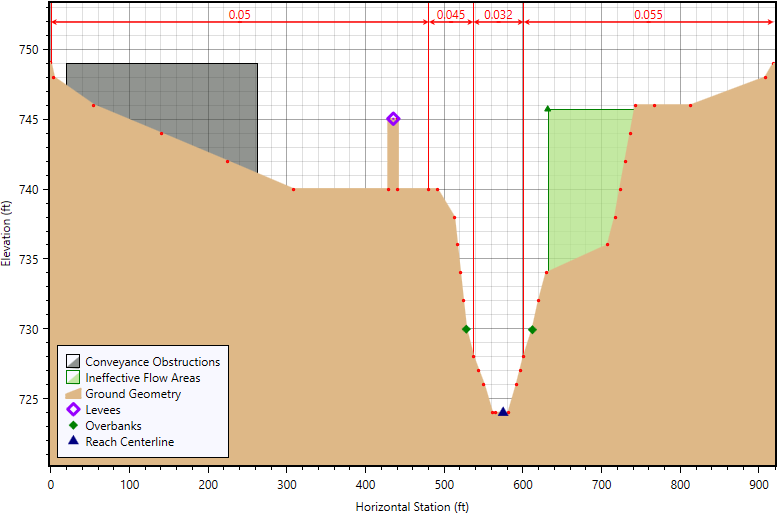
Improved Ground Point Reduction
The Ground Point Reduction command contained within the Cross Section Data and Bridge & Culvert Data dialog boxes now allows the user to specify exactly what part of the cross section that the ground geometry (or roadway geometry) point reduction should be applied at. The user can choose from the following:
- Entire Cross Section
- Left Overbank Area
- Channel
- Right Overbank Area
- Both Overbank Areas
Improved Flood Map Computation
When creating a flood map, the software will now automatically weed out excessive vertices for the edge of water. This allows the flood map file size to be smaller and easier to process when exported out to either a CAD drawing or GIS shapefile.
Improved Text Rendering for AutoCAD & MicroStation Drawings
The text rendering is greatly improved for AutoCAD and MicroStation drawing files, matching the original drawing nearly exactly.
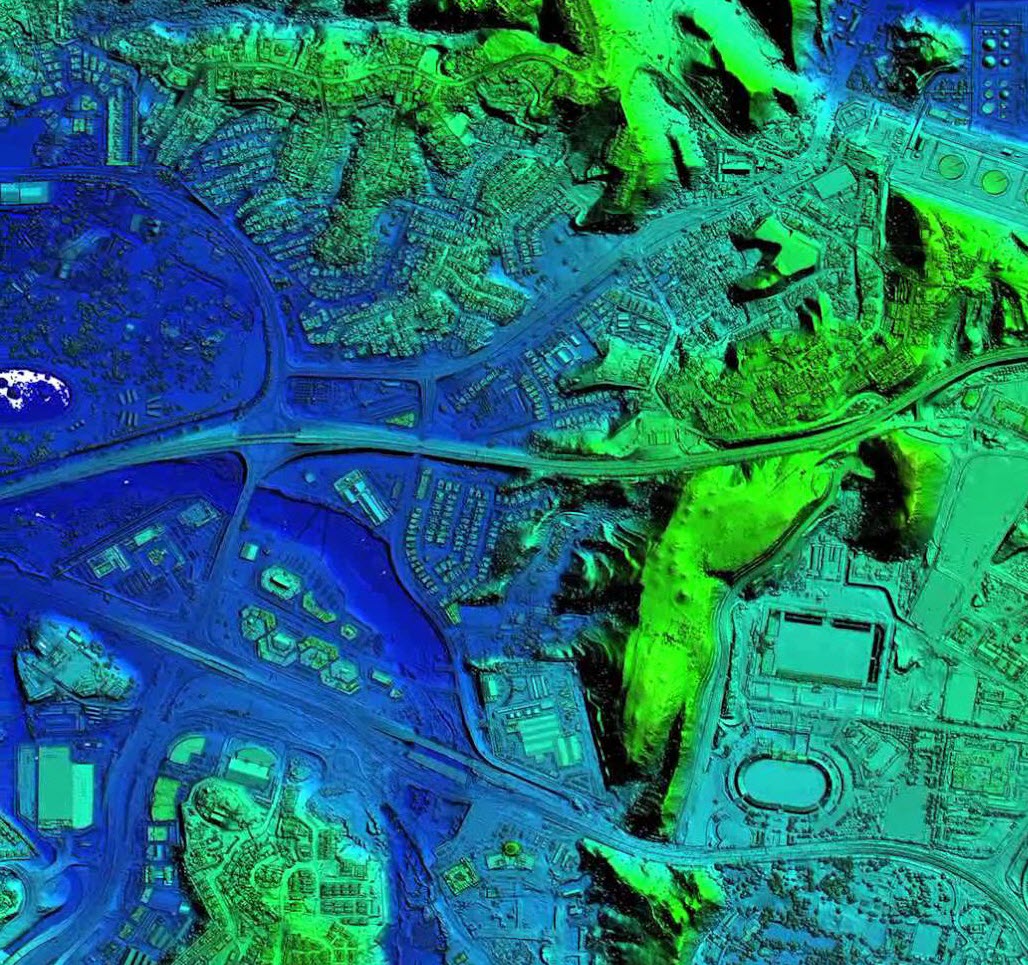
Improved Color Shading of Elevation Grids
The color shading routine has been improved to provide a much more realistic representation of elevation grids. The user has the choice to define various options in hill shading routine, to allow specific display requirements to be fulfilled including color blending. In addition, color shading and hill shading speed has improved.
Improved HEC-RAS Display Options
Additional functionality for displaying HEC-RAS elements (i.e., cross sections, roadway crossings, etc.) has been implemented. For example, roadway crossings, inline structures, lateral structures can be shown in an outline view so that the user can see the map data underneath the structure. Similarly, when measuring distances on a structure, the interior filling of the structure is temporarily hidden so that the user can see the map data under the structure.
Improved CAD Properties Dialog Box
The software allows the user to select one or more layers at a time for assigning properties, such as visibility, line widths, line styles, line colors, and more. In addition, the dialog box has been made wider, allowing the user to see longer layer names.
Improved USGS StreamStats Support
The USGS StreamStats command has been improved to provide a more robust computation for various locations within the United States. Unfortunately, the USGS StreamStats routine is limited to specific states at this time. We have been informed that the USGS will continue to improve the StreamStats capability and provide complete coverage for the United States.
Improved Draw Polygons Command
The software will now create adjacent polygons when digitizing a polygon next to another polygon. The two polygons will now share a common polyline edge between them. To create an adjacent polygon, start digitizing within the adjacent polygon. The software will find the common polyline edge between the polygons.
Improved Determination of Lateral Structure River Station
While defining a lateral structure using the Draw Lateral Structure or Assign Lateral Structure commands, the software accurately determine the corresponding river station for the lateral structure with the associated river reach.
Improved Draw Sloping Abutment Command
The Draw Sloping Abutment command within the Bridge & Culvert Data dialog box has been improved to allow the user to draw the sloping abutment from left to right or right to left.
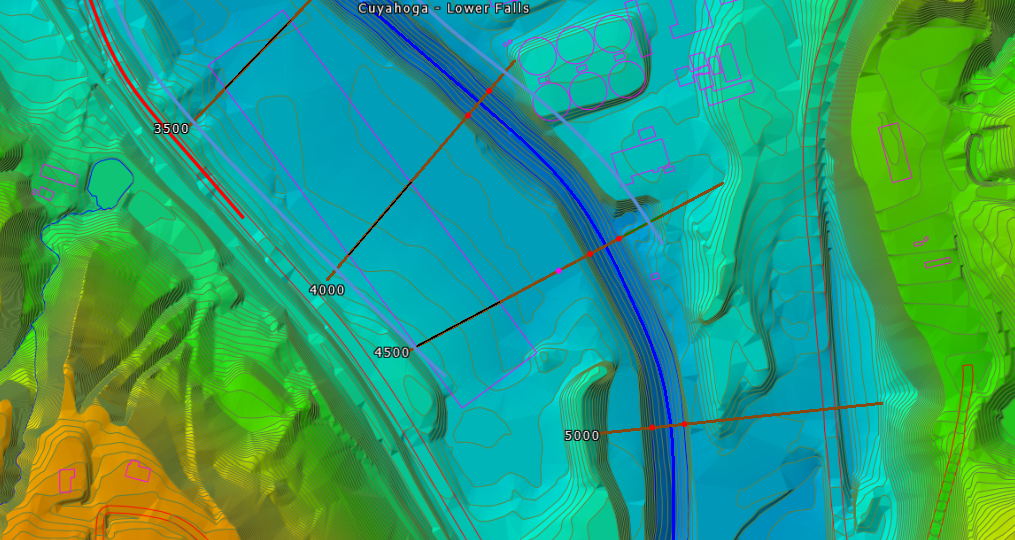
Improved Automated Draw Cross Sections Command
The Automated Draw Cross Sections command has been vastly improved, allowing the software to more smartly locate cross sections for sinuous (i.e., bendy) rivers and over 400% faster. Additional functionality has been provided to give the user more control on the exact placement of the cross sections during the automation process—especially for sinuous, meandering rivers.
Point Filter Incorporated into Conflate Points Command
The software allows survey points to be filtered based on the point description or field code. This allows more flexibility and control when using a variety of data with the Conflate Point command. For example, when importing survey data at a roadway crossing, the user can exclude data that is not relevant to providing the necessary elevation data for the channel geometry, low chord geometry, and high chord geometry. In addition, the point filter is remembered during the application session.
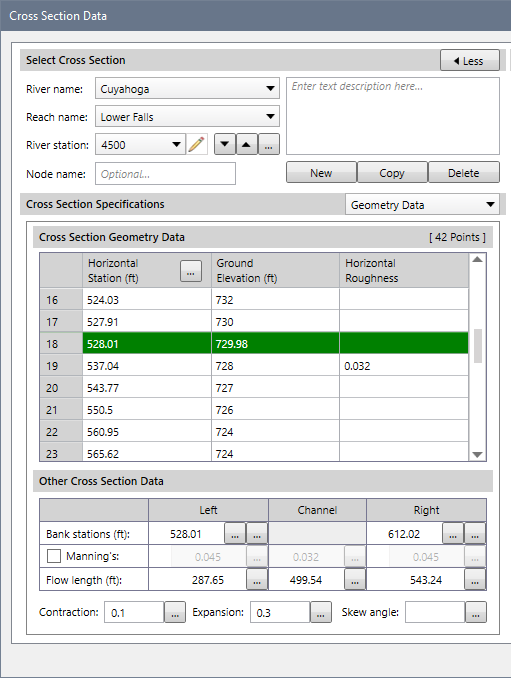
Reversed Text Color for Highlighted Bank Rows
The Cross Section Data dialog box highlights the ground station rows that correspond to the bank stations in a green colored row. The black text of the ground station and elevation was difficult to read, so this text color is now reversed so it can stand out against the green colored row.
Importing Multiple HEC-RAS Scenarios (Plans)
The HEC-RAS Import Project command now allows the user to select more than one scenario (i.e., plan) to be imported. This gives the user more control over the data being imported.
Exporting Multiple HEC-RAS Scenarios (Plans)
The HEC-RAS Export Project command now allows the user to select more than one scenario (i.e., plan) to be exported. This gives the user more control over the data being exported.
Additional LandXML Support
The software supports additional LandXML entities, such as polylines, points, and COGO points. This provides additional ways to import data into the program.
Support for TIN Boundaries
While importing a TIN, the software will determine the TIN boundary. This helps when determining the terrain boundary limits, especially when generating elevation grids and flood maps. The generated terrain model will be cropped to the TIN boundary.
Cogo Point Support for Conflate Point Data command
The Conflate Point Data command now supports AutoCAD cogo points data when assigning cross section geometry stations and elevations. COGO points, in addition to coordinate data, have a variety of properties associated with them, including point number, point name, and field description.
Autosave Improvements
Autosave will not immediately fire after running a long command.
Improved HEC-RAS Labeling
Labeling of HEC-RAS cross sections, crossings, and lateral structures has been greatly improved. The labels no longer overlay on top of the element. Label options include aligning the label with its corresponding element (i.e., parallel to cross section alignment) and horizontal alignment.
Remember River Reach
The software now remembers which river reach you are working with. In that way, all of the commands reference the same reach and you do not need to select the reach for each command.
Zoom to Command (Ctrl+F Keypress)
The Zoom to command has been improved to use the Google location search function so that it is easier to handle misspelled location names, etc. Pressing Ctrl+F will automatically start the Zoom to command. In addition, the command runs much faster than before. And, the last 10 searches are remembered.
Zoom to Location Command
The Zoom to Cross Section command has been changed and renamed to Zoom to Location so that the user can zoom to any type of structure including roadway crossings, inline structures, and lateral structures. In addition, the node name and description are also displayed making it easier for the user to select the appropriate location.
Georeference Cross Sections Command Improvements
Additional functionality has been added to the Georeference Cross Sections command, including the ability to draw a portion of the cross section polyline and have it intersect the original cross section at two locations to define the change between the points of intersection.
Georeference River Reaches Command Improvements
Additional functionality has been added to the Georeference River Reaches command, including the ability to draw a portion of the revised river reach polyline and have it intersect the original river reach at two locations to define the change between the points of intersection.
Georeference Roadway Crossings Command Improvements
Additional functionality has been added to the Georeference Roadway Crossings command, including the ability to draw a portion of the revised roadway crossing alignment polyline and have it intersect the original roadway crossing alignment at two locations to define the change between the points of intersection.
Georeference Inline Structures Command Improvements
Additional functionality has been added to the Georeference Inline Structures command, including the ability to draw a portion of the revised inline structure alignment polyline and have it intersect the original inline structure alignment at two locations to define the change between the points of intersection.
Remembering Defined CAD Layer Filters
After defining a filter for the CAD layers listing in the CAD Properties dialog box, the defined filter settings were lost when redisplaying the dialog box. In addition, the filtered list was restored to show all of the layers. This issue has been fixed.
CRS Exported with AutoCAD Drawing File
When the user exports an AutoCAD drawing file from the software, the associated project coordinate reference system (CRS) is now included. This assists the user in georeferencing the exported drawing in Civil 3D and other software programs.
Immediate Project Saving
Some commands, such as when generating of a terrain surface, require that a new project be saved first so that the software knows where created project data will be stored. Previously, the user would have to stop the desired command, go save the project, and then return to the command and continue. Now the software provides the user opportunity to directly save the project during the command and continue—saving valuable time and removing unnecessary steps.
Export HEC-RAS to Shapefiles Command
Cross sections are now exported out as 3D polylines. They now represent the 3D horizontal stationing and elevation of the HEC-RAS cross sections.

What’s Fixed
Merging River Reaches Caused Lost Flow Data
Using the Merge Polylines command, the user can merge connected river breaches into a single reach. When doing this the flow data defined for the river reach was sometimes lost. This issue has been corrected.
HEC-RAS 5.0 Lateral Structure Georeferencing
HEC-RAS 5.0.3 provides support for lateral structure georeferencing. Previous versions of the software did not support this functionality. This issue has been corrected.
HEC-RAS Element Descriptions containing “=” Equal Signs
HEC-RAS uses tags for the input data files that include “=” equal signs. However, if the user placed an equal sign in cross section and other element descriptions, the software sometimes misinterpreted the description as part of the HEC-RAS input data definition. This issue has been corrected.
Resizing AutoCAD Drawing Issues
When manually resizing an imported AutoCAD drawing, the software would sometimes fail to properly resize the AutoCAD drawing, and in extreme cases crash the program. This issue has been corrected.
Exporting Layers to AutoCAD with Names Containing Colons
AutoCAD has a limitation in that drawing layers cannot contain a “:” colon character. When exporting layers to AutoCAD that have names containing a colon, the software will substitute these with an “_” underscore character.
USGS Land Cover Data Layer
The USGS Land Cover Data online map service was failing as they have changed the web map service. This issue has been fixed.
Allow Negative River Stationing
The Edit River Stations, Node Names & Descriptions command is used for renumbering cross sections based upon various criteria. However, it did not allow a negative river station to be assigned as the starting downstream most cross section. This issue has been fixed.
Default Drawing Layer Lock Issue
Locking the default drawing layer also inadvertently locked the HEC-RAS layer. This issue has been fixed.
Unable to Graphic Edit Cross Sections with Results
The software prevented the user from being able to edit the cross section elements, such as ineffective flow areas, when the water surface profile results were plotted on the cross section. This issue has been fixed.
Find more information on our Knowledge Base or join the conversation about GeoHECRAS. Follow us on Facebook, Twitter, LinkedIn, and Google+ using #GeoHECRAS, #ReadyToEngineer.