

Rainfall Data in Transition: NOAA Atlas 14 to Atlas 15
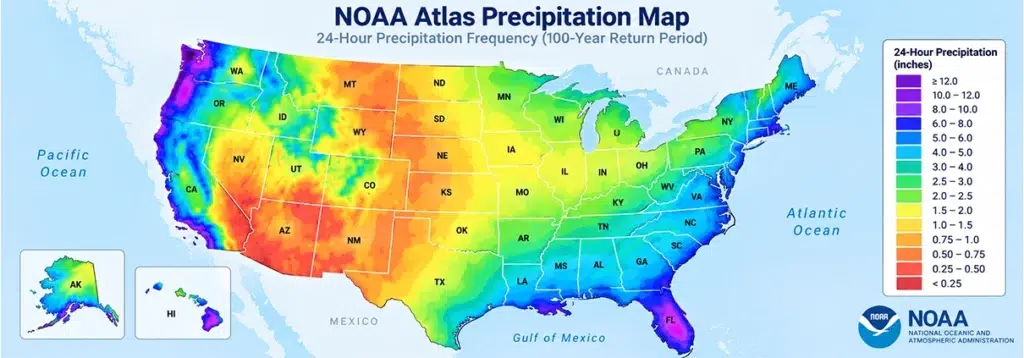
Summary: NOAA Atlas 14 remains NOAA’s current precipitation-frequency standard and authoritative source for the areas it covers, while Atlas 15 will gradually replace it with updated, seamless, nonstationary estimates nationwide. Preliminary CONUS data are expected in September 2026 for peer review, with CONUS publication in 2027 (estimates outside the contiguous United States (oCONUS) follow in 2028). Atlas 15 is a schedule, not a switch.
Most design-storm hydrologic models begin with a precipitation-frequency depth obtained from a regional study rather than rainfall measured at the project site. In the United States, that value usually comes from NOAA Atlas 14, the current authoritative source of precipitation-frequency information for most of the country. Its estimates influence culvert sizing, detention requirements, storm sewer design, floodplain mapping, and minimum floor elevations.
That standard is being replaced. NOAA is building a successor, NOAA Atlas 15, which drops one of Atlas 14’s founding assumptions and will eventually cover the country in a single spatially continuous dataset. Here is where Atlas 14 stands today, where Atlas 15 stands as of September 2026, and what both mean for the precipitation inputs already sitting in our models.
What NOAA Atlas 14 gives us today
NOAA Atlas 14, Precipitation-Frequency Atlas of the United States, comes from the Hydrometeorological Design Studies Center within the National Weather Service’s Office of Water Prediction. NOAA describes Atlas 14 as the authoritative source of precipitation-frequency information used for infrastructure design and flood-risk management. Atlas 14 estimates feed hydrologic models, storm sewer design, and floodplain analyses used in FEMA’s National Flood Insurance Program.
For a covered location, Atlas 14 provides point precipitation-frequency depths from 5-minute to 60-day durations and frequencies from the 1-year through 1,000-year recurrence interval, together with 90 percent confidence intervals. Atlas 14 frequency analysis uses annual maximum series (AMS) data, with PDS-based precipitation-frequency estimates derived from the AMS analysis for the published estimates in the later Atlas 14 volumes. The distinction matters most for frequent events: PDS can represent more than one exceedance in a year, so NOAA considers PDS-based results more suitable for designs based on frequent events. AEP describes the annual probability of exceedance, while ARI expresses the corresponding recurrence interval; these concepts should not be treated as synonymous with AMS and PDS. Engineers retrieve the estimates from the Precipitation Frequency Data Server (PFDS).
The catch is in how Atlas 14 was delivered. It came out one region at a time over more than 20 years. Volume 1 final data were first released in 2003, with final documentation following in 2004. Volume 12, covering Idaho, Montana, and Wyoming, took effect on August 31, 2024, replacing NOAA Atlas 2 data that had been in place since 1973. That is a 51-year gap. So “Atlas 14” is not one vintage of data, and two gaps are worth carrying around:
- Oregon and Washington have not received NOAA Atlas 14 precipitation-frequency updates. Design work there still runs on pre-Atlas 14 products: mainly NOAA Atlas 2 from 1973 for the 1-hour to 24-hour range, with Arkell and Richards (1986) below that and Technical Paper 49 from 1964 above it.
- Volume 13 is still in development. It covers Delaware, the District of Columbia, Maryland, North Carolina, Pennsylvania, South Carolina, and Virginia. Preliminary estimates underwent public peer review in 2025, and NOAA continued addressing review comments during 2026. Volume 13 is also a useful bridge to Atlas 15: NOAA describes it as a stationary analog of the methodology being used for Atlas 15, with several methodological updates aligned to the next-generation standard.
Stationarity, and what Texas showed
Stationarity is the assumption that the statistical behavior of extreme precipitation does not change over time, so a long historical record is treated as representative of future conditions. Atlas 14 is built on that assumption. NOAA is explicit that its successor is not: Atlas 15 represents a shift to nonstationary methods that account for temporal trends in observed extreme precipitation.
Texas shows what can happen when a precipitation-frequency study is refreshed with a longer record, additional extreme events, more observations, and updated statistical methods. NOAA released Atlas 14 Volume 11 for Texas in September 2018, extending the record through December 2017 and including Hurricane Harvey. In the Houston area, the 100-year, 24-hour depth rose from about 13 inches to as much as 18 inches. That put the new 100-year depths close to the old 500-year depths in some locations. Across Harris County, 100-year depths increased by roughly 3 to 5 inches. The design consequences were substantial: many projects needed to re-evaluate conveyance, detention, freeboard, and other criteria.
That change should not be read as a standalone demonstration of nonstationarity. The difference between the old and new Texas estimates reflects several factors at once, including a longer observational record, Hurricane Harvey and other extreme events, additional gauges, and methodological improvements. The engineering lesson is not that every Atlas update will produce the same direction or magnitude of change. It is that the source and vintage of a design-storm input matter.
TxDOT called the new data “best available data” in a memo dated November 29, 2018, and staged it by project phase, leaving late-stage redesign “at the district’s discretion.” The memo is also candid about a problem that outlives the update itself. Rational Method software, it notes, “often has Intensity-Duration-Frequency (IDF) curves from prior rainfall data embedded into the software.”
That acronym is worth pinning down, because IDF curves are how many engineers actually encounter these data. An IDF curve gives rainfall intensity for a given duration and frequency. A depth-duration-frequency, or DDF, curve expresses the same relationship as total depth rather than intensity. Both are derived products. Both are only as current as the precipitation-frequency source behind them, and neither announces its own vintage when embedded in a spreadsheet, template, or software library. To learn more about defining IDF curves for stormwater modeling, refer to this article in our knowledge base.
TxDOT’s instruction was not to throw the old curves out. Designers “may continue to use these older values but should evaluate the new NOAA rainfall changes for their project area and, if there are increases, estimate an appropriate level of freeboard for use.” That is an example of agency-specific transition guidance, not a universal rule. The broader lesson is that legacy values can remain in service on some projects only when the governing criteria allow it and the engineer understands what vintage is buried in the tool.
Which raises the obvious question. If one refresh can move a 100-year depth toward what the 500-year depth used to be in parts of a major metropolitan area, how much confidence should we place in a design storm whose source, volume, and vintage are not documented?
What NOAA Atlas 15 changes
NOAA Atlas 15 is the new national precipitation-frequency atlas, developed by the National Weather Service’s Office of Water Prediction. Atlas 15 introduces three major changes: spatially continuous national coverage in place of a sequence of independently developed regional volumes, nonstationary statistical methods that fit temporal trends in the observed record rather than assuming those statistics are constant, and future-oriented estimates that apply climate-model information to project precipitation-frequency changes forward in time.
It arrives in two volumes:
- Volume 1 provides present-day precipitation-frequency estimates that account for temporal trends in historical observations. When published, this is the volume that supersedes Atlas 14 as NOAA’s national precipitation-frequency standard.
- Volume 2 provides model-based precipitation-frequency estimates projected into the future, delivered as adjustment factors applied to Volume 1 and derived from downscaled climate-model information. NOAA’s framework extends the projections through 2100.
At full release, the dataset is planned to cover annual exceedance probabilities extending to 0.1 percent, with durations from 5 minutes to 60 days.
NOAA Atlas 15 is not available for design use yet. As of September 2026, the only public dataset is the Montana pilot, released on September 26, 2024. The pilot did not go through the full peer-review process and was released for comparison and feedback. NOAA plans to release preliminary estimates for the contiguous United States by September 2026 for peer review, followed by published estimates in 2027. Until publication, Atlas 14 remains NOAA’s current national standard for the areas it covers.
| When | What |
|---|---|
| September 2024 | Montana pilot project available for early feedback |
| September 2026 | Preliminary estimates for the contiguous United States available for peer review and feedback |
| 2027 | Published estimates for the contiguous United States “available for use and application”; preliminary estimates outside the contiguous United States available for peer review and feedback |
| 2028 | Published estimates outside the contiguous United States available for use and application |
Atlas 15’s schedule has already encountered disruption. Funding for Volume 2 was briefly halted in July 2025 and then reinstated. The episode underscored how consequential the dataset is to engineering practice, but NOAA’s current schedule again calls for preliminary contiguous-U.S. estimates by September 2026 and published estimates in 2027.
Atlas 15 is a schedule, not a switch. Preliminary data are for peer review, not for design. When Volume 1 is published, it will supersede Atlas 14 as NOAA’s authoritative national precipitation-frequency standard. Design requirements, however, will transition separately as federal, state, local, and client criteria incorporate the new estimates into manuals, regulations, and review procedures. Publication and regulatory adoption are related milestones, not the same event.
Depth is only half of a design storm
A precipitation depth sets a storm’s total volume but says nothing about how quickly that volume arrives. The temporal distribution does that job, turning a depth into a hyetograph. Its effect on peak discharge and hydrograph timing can be substantial, particularly when the period of greatest rainfall intensity aligns with the watershed’s critical response time. Atlas 14 provides temporal patterns grouped by duration, by the storm quartile containing the greatest share of precipitation, and by percentile. HEC-HMS identifies Atlas 14 as the best available U.S. product for frequency-storm depths and can import NOAA’s temporal patterns. GeoHECHMS supports this workflow by automating design-storm assignment and retrieving precipitation depths and storm distributions from authoritative data sources based on the project location. To learn more about defining precipitation data for stormwater modeling, refer to this article in our knowledge base.
Many of the synthetic distributions engineers learned first also need careful re-evaluation. NRCS guidance warns that a rainfall distribution developed before the applicable Atlas 14 volume should not be used without evaluating the embedded rainfall ratios. The reason is straightforward: a legacy Type II or Type III distribution contains fixed relationships among short- and long-duration depths, and those ratios may not match the site-specific Atlas 14 DDF relationship. TxDOT, for example, allowed Type II and III distributions to remain appropriate in Texas under its own guidance. Depth and distribution therefore move on separate clocks. So do areal reduction, storm duration, and spatial rainfall pattern, all of which depend on the modeling method and governing agency rather than the atlas alone. To learn more about defining an SCS design storm and retrieving precipitation data for a project location, refer to this article in our knowledge base.
One more distinction matters: Atlas 14 and Atlas 15 precipitation-frequency depths are point estimates, meaning they are spatially independent estimates at a specified location and are not automatically equivalent to a watershed-average storm depth. For watershed-scale design, engineers need to consider point-to-area reduction, spatial distribution of precipitation, storm duration, and the requirements of the governing agency. In HEC-HMS, those are explicit hypothetical-storm inputs separate from the NOAA point depth.
A design-storm provenance checklist
The uncomfortable part of the Texas story is not that the data changed. It is that many projects can carry precipitation depths whose provenance nobody can state precisely, and one major update can make that weakness visible all at once.
Design-storm precipitation is one of the major model inputs engineers often inherit rather than measure at the project site. A survey, soil map, terrain surface, and land-use layer usually carry visible source information. A design storm can arrive as a number from a national study, get typed into a model or inherited from a template, and then outlive the memory of where it came from. Legacy IDF curves buried in a tool are the same problem in a different form. Fixing it takes nothing exotic. For every design-storm value in a model, record four things:
- Which atlas, volume, or other precipitation-frequency source produced the depth, and the date or version that applied. “NOAA Atlas 14” alone is not an answer.
- Which duration and frequency were used, including whether the value is expressed as AEP or ARI and whether it is an AMS- or PDS-based estimate.
- Which temporal distribution was applied and where it came from: a NOAA temporal pattern, an NRCS regional distribution, or a legacy synthetic type.
- How the point precipitation depth was converted to watershed precipitation, including any areal reduction factor or spatial-distribution method, and what governing agency or client criteria applied at the time, including any required storm duration, freeboard, safety factor, or transition policy.
A model that carries those four facts can survive a reviewer’s question, a staffing change, and a future atlas update. A model that does not carry them makes it harder to determine whether a change in results comes from hydrology, precipitation, software, or design criteria.
Atlas 15 will arrive as a sequence of releases, not a single announcement. That gives the profession something valuable: a standard change that can be prepared for. The goal today is not to guess tomorrow’s Atlas 15 depth. It is to know exactly where today’s inputs came from so that, when the new estimates become applicable, the effect of the change can be isolated and defended.
Preparing existing models for Atlas 15
Before Atlas 15 becomes applicable to a project, engineering teams can make existing models easier to update without changing the approved design basis prematurely. A practical readiness review should identify the NOAA atlas and volume behind each precipitation depth or IDF curve, archive the source DDF/IDF data, document temporal patterns and storm duration, record any areal-reduction or spatial-distribution method, and flag templates or software libraries that contain embedded legacy rainfall data. The review should also record the agency criteria and project phase that governed the current model.
Once Atlas 15 is published and adopted for a project, rerun the rainfall-dependent portions of the analysis as a controlled comparison. Change the precipitation-frequency input first, hold unrelated model parameters constant where practical, and document the resulting changes in runoff volume, peak flow, water-surface elevations, storage requirements, and design margins. That makes the transition an engineering change-management exercise rather than an undocumented model rebuild.
Frequently Asked Questions
What is the difference between NOAA Atlas 14 and NOAA Atlas 15?
NOAA Atlas 14 consists of regional volumes developed over more than 20 years and assumes statistical stationarity. NOAA Atlas 15 will provide spatially continuous national estimates and use nonstationary methods that account for observed temporal trends. Volume 1 will replace Atlas 14 as NOAA’s present-day standard, while Volume 2 adds future-oriented adjustment factors based on climate-model projections.
Can NOAA Atlas 15 be used for design today?
No. As of September 2026, the Montana pilot is the only public Atlas 15 dataset, and it was released for comparison and feedback rather than design. Preliminary estimates for the contiguous United States due by September 2026 are for peer review. Published CONUS estimates are scheduled for 2027, with estimates outside the contiguous United States (oCONUS) following a year later. Publication by NOAA does not automatically change a project’s governing design criteria: federal, state, local, transportation, floodplain, and client requirements may still need to separately adopt or reference the new estimates before they apply.
When will NOAA Atlas 15 be released?
NOAA Atlas 15 is scheduled for a staged release rather than a single release date. Preliminary estimates for the contiguous United States (CONUS) are scheduled for September 2026 for peer review and feedback, with published CONUS estimates scheduled for 2027. Preliminary estimates outside the contiguous United States are scheduled for 2027, with published estimates in 2028. Preliminary estimates are for review, and agencies may adopt the published data on their own schedules.
What does the shift from stationary to nonstationary statistics mean?
Stationarity assumes the statistical behavior of extreme precipitation is constant over time. Atlas 15 Volume 1 uses nonstationary methods to account for trends observed in the historical record. That does not mean every location or frequency will increase by the same amount; the effect will depend on the local record, duration, frequency, and final NOAA methodology.

 English
  French
  German
  Italian
  Spanish
  Chinese
  Polish
  Indonesian