GeoHECRAS Update: Next-Generation 2D River Flood Modeling Software

Nov 30, 2018 Release
We are glad to announce the release of GeoHECRAS Version 2.6. It’s been busy here and we have added a full spectrum of advanced new features requested by our customers. This new version provides complete support for HEC-RAS 5.0.6, along with an improved user-interface featuring modeless data dialog boxes; new features for river geometry modeling, model adjustments, computations, and reporting; additional functionalities for advanced 2D meshing; support for network deployment and licensing; upgraded support for StreamStats 4.0 and ability to access external map servers.
We have also updated different existing features that will improve the user’s efficiency. Speed improvements and optimizations in HEC-RAS model creation and review are evident. In addition, profile line plots and time series plots have been further improved for better visualizations.
Let’s see what is in this latest release…
What’s New
Modeless Data Dialog Boxes
The software has been rearchitected so that the data dialog boxes (e.g., Cross Section Data, Bridge & Culvert Data, etc.) are modeless, allowing the user to interact with one or more Map View windows at the same time without having to close the data dialog box. For example, the user might have two different HEC‑RAS projects open at the same time, and then display the Cross Section Data dialog box. The user can then zoom and pan in either Map View window, and display the data for the selected cross section in the Cross Section Data dialog box.
Clicking on a different element type, such as an inline structure, will cause the current data dialog box to close and the new data dialog box to open at the same location. For example, the user can “park” the Cross Section Data dialog box on a second monitor while interacting with the Map View. Clicking on a cross section will cause the Cross Section Data dialog box to display data corresponding to the selected cross section. Then, clicking on a roadway crossing (i.e., bridge structure) will cause the Cross Section Data dialog box to automatically close and the Bridge & Culvert Data dialog box to open at the same location on the second monitor.
Hexagonal Meshing Scheme
In addition to the uniform and adaptive meshing schemes, a new hexagonal meshing scheme has been added. This meshing scheme creates cells that have 6 sides, which makes it much more resilient to sudden changes in flow direction when compared to other meshing schemes. Hexagonal meshes are highly efficient for computing complex flow directions since they contain 6 faces.
Zonal Meshing
It can take a significant amount of time to manually create and refine a 2D mesh to get the results desired. The user can now define polygonal zones within the 2D flow area where specific meshing schemes are specified. The selected mesh influences the accuracy, convergence, and speed of the solution. Zonal meshing provides the user with the flexibility to mark out specific zones (or regions) where the user can place the right mesh in the right place to ensure that the simulation will accurately represent the physical environment. The meshing algorithm will automatically adjust the mesh to account for the element change along the zone boundaries. Further refinement can then be made to the mesh to improve the accuracy of the solution.

Dynamic Color Rendering of Terrain Surface
To improve terrain surface visualization, the software dynamically color renders the terrain surface using the minimum and maximum elevation range for the terrain displayed in the Map View. As the user zooms in to an area of interest, the software automatically recomputes the min-max elevation range and recolors the terrain to show additional detail at the higher zoom level. All of this occurs instantaneously as the user zooms and pans about the project area.
HEC-RAS Version 5.0.6 Support
GeoHECRAS provides support for the following versions of HEC-RAS, selectable from the Options backstage page:
- Version 5.0.6 (1D and 2D models, steady and unsteady flow)
- Version 4.1.0 (1D models only, steady and unsteady flow)
- Version 3.1.3 (1D models only, steady and unsteady flow)
- Version 3.0.1 (1D models only, steady flow only)

Stamp Geometry
The Stamp Geometry command allows the user to draw a polyline and have the software automatically sample the cross sectional geometry at the ends of the polyline, and then linearly interpolate the cross section shape along the drawn polyline, revising the terrain model. This can be used to quickly “burn-in” a channel where one is missing, or “fill-in” a levee or dam structure where one is proposed.

Cross Section Geometry Comparison & Replacement
The Geometry Comparison panel, available in the Cross Section Data dialog box, allows the user to select a comparison cross section to display in the cross section plot. Additional functionality is provided, allowing the user to align the comparison cross section with the current cross section, and even replace parts of the current cross section ground geometry with that from the comparison cross section. Comparison cross sections from other geometry files and plans can be selected, allowing the user to quickly compare different model geometries and better understand the resulting differences.

Interpolate Cross Sections Command
The software can automatically create interpolated cross sections between user-defined cross sections, similar to HEC-RAS. The user can select the river reach region within which interpolated cross sections can be created. The user can then define the maximum distance between cross sections. In addition, previously interpolated cross sections can be deleted.

2D Model Internal Boundary Conditions
2D flow models can now have internal boundary conditions defined, allowing flow to be inserted into the middle of the 2D mesh—like a stormwater drainage network that discharges into the river for a 2D model.
Restart (Hotstart) File Support
When running HEC-RAS unsteady flow simulations, instabilities may occur at the beginning of the simulation because of bad initial conditions. One way to fix this is to run the model with the inflow hydrographs set to a constant flow rate and the downstream boundaries to a high tailwater elevation. Then, run the model and gradually lower the tailwater elevation to a reasonable depth. Once this has been achieved, the model simulation results can be written to a restart (or hotstart) file. The restart file can then be used as the starting conditions for the unsteady flow analysis.
StreamStats Version 4.0
Support has been updated for the new StreamStats version 4 for computing stream discharge values. The computed discharge values can be used for floodplain modeling, bridge design, and a variety of other uses. Additional coverage areas in the United States have been added. Updated regression equations have been incorporated, providing the latest peak-flow frequency values for each state.
Watershed Boundaries Download Command
Download watershed boundaries as shapefile data from the EPA/USGS NHD Plus (National Hydrography Dataset) for a defined region. This command is only available for areas in the USA.
External Map Server Support
Support for external online map servers is provided, allowing users to access the following map services with their HEC-RAS project:
- WMS (Web Map Service)
Several predefined map services are provided, such as the Army Corps Levees WFS and WMS map services, providing downloadable GIS data for all federal levees.
Remember HEC-RAS Result Display Options
When plotting cross section results and profile results, any user-defined display options and settings are remembered along with the project settings. The next time the project is loaded, the same display options are retrieved and used.
Loading HDF Grid Files
Support has been added for reading HDF (Hierarchical Data Format) files, both for land use and terrain surfaces. The software automatically determines the HDF file type when loading an HDF file.
Unsteady Flow & Stage Ordinates
Support for long term unsteady flow boundary condition data has been provided. The maximum number of unsteady flow and stage ordinates has been increased from 10,000 to 50,000 (HEC-RAS maximum number of supported ordinates).
Cross Section Direction Arrows
To display the implied cut (or draw) direction for cross sections on the Map View, direction arrows can be displayed on the cross sections using the HEC-RAS Properties dialog box. HEC-RAS expects cross sections to be drawn from left to right, oriented in a downstream direction. GeoHECRAS automatically ensures that cross sections constructed within the software are created this way. However, imported HEC‑RAS models may have cross sections that are drawn in the other direction. Displaying cross section direction arrows can assist in correcting this issue when georeferencing a model to real-world coordinates.
If a cross section is drawn in the wrong direction, the Reverse Cross Section Geometry command can be used to flip the cross section geometry, end to end.

Cross Section ID Location
The cross section ID labels displayed on the Map View can be located on either the left or right hand side of the cross section line using the display options available within the HEC-RAS Display Properties dialog box. In addition, the user can grab the cross section ID labels and manually move them and the software will use the new location from that point forward. To restore the cross section ID label locations, click the [Reset Label Locations] button in the HEC-RAS Properties dialog box and any user-defined cross section ID label locations will be removed.
Adjust Elevations Command
The Adjust Elevations command allows the user to select a region on a 2D elevation grid and perform the following modifications to the underlying elevation grid cells:
- Set elevation
- Add or subtract elevation offset
- Multiply elevations with a scale factor
For example, HEC-RAS does not allow buried culverts in 2D models. This command can be used to lower the terrain surface elevations of the cells at a culvert entrance and exit to match the culvert invert elevations.

Build Sloping Abutment Command
Within the Bridge & Culvert Data dialog box Sloping Abutments panel, the software can automatically construct sloping abutments using the station and the elevation of the top edge of the abutment, along with the defined slope.

Similar functionality has been added to the Bridge & Culvert Data dialog box Build Bridge Opening panel.
Reading HEC-RAS Model Results
The software will automatically load results from previous model runs, including imported HEC-RAS models. There is no need to rerun the HEC-RAS simulation in order to access already computed results.
Fill Holes Command
The Fill Holes command allows the user to fill holes contained within a polygon, such as a flood map, by either specifying a minimum size (i.e., area) or by manually selecting the holes.

SA/2D Flow Area Connection Geometry Adjustment
The user can adjust the cross section geometry for a storage area / 2D flow area connection by adjusting the geometry elevation data up or down.
Split Polylines Command for HEC-RAS Elements
The Split Polylines command works for the following HEC-RAS elements:
- River reaches
- Cross sections
- Roadway crossings
- Inline structures
- Lateral structures
- Breaklines
- Boundary condition lines
For example, using this command on a river reach causes the software to automatically insert a junction at the location of the split, causing two river reaches to be created.
Merging River Reaches
Deleting a junction between two connected river reaches causes the software to automatically merge the two river reaches into a single reach. In addition, the command handles any cross section river stationing issues and deletes the previous river junction.
Merge Polylines Command for HEC-RAS Elements
The Merge Polylines command works for the following HEC-RAS elements:
- River reaches
- Breaklines
For example, using this command on two connected river reaches causes the software to merge the two reaches together as a single river reach, automatically handling any cross section river stationing issues.
Split Polygons Command for HEC-RAS Elements
The Split Polygons command works for the following HEC-RAS elements:
- Storage areas
- 2D flow areas
For example, using this command on a 2D flow area causes the software to create two adjacent 2D flow areas.
Merge Polygons Command for HEC-RAS Elements
The Merge Polygons command works for the following HEC-RAS elements:
- Storage areas
- 2D flow areas
For example, using this command on two adjacent 2D flow areas causes the software to merge the two flow areas together as a single 2D flow area, with a breakline where the shared boundary between the two 2D flow areas previously existed.
Export to Google Earth
The exported Google Earth HEC-RAS model now includes the cross section geometry and computed flood results as a graphical plot for each cross section.

Loading Project Files
When double clicking on a project GHR file using Windows Explorer, the software automatically determines which version of GeoHECRAS (i.e., 1D or 2D) should be used to open the project file.
Project Details
In the Scenario Manager, clicking on the [Summary] button will display an informational dialog box that provides a detailed overview of the project:
- Number of scenarios (plans)
- Number of geometry definitions
- Number of flow definitions
For each scenario, a detailed summary of the elements that make up the scenario is provided:
- Number of river reaches
- Number of cross sections
- Number of roadway crossings
- Number of 2D elements
- etc.
2D Flow Area Boundary Condition Terrain Plot Command
The user can right click on a 2D flow area boundary condition line and choose to plot the terrain geometry. This is helpful in confirming that the defined boundary condition data is compatible with the terrain geometry.
Advanced Time Step Control
When performing a HEC-RAS unsteady flow model simulation, the software now allows you to define a variable time step based upon the wave speed (Courant number). You can request that HEC-RAS automatically adjust the computational time step to match the velocity of the flow or retention time to stabilize the computations.

Culvert Alignment
For roadway crossings, inline structures, lateral structures, and storage area/2D flow area connections, culverts can now have an (optional) horizontal alignment assigned to them. This allows the modeler to place the culvert inlet and outlet at precise locations, along with bends in the horizontal plane to account for alignment changes in the culvert. Additional losses due to the bends are not considered in the simulation.
When defining the alignment, the user can either select an alignment polyline from the Map View or draw the alignment on the Map View. For 1D models, the upstream and downstream roadway horizontal stationing for the culvert opening is precisely computed, along with the culvert length. For 2D models, the software can extract flow and discharge flow at a specific user-defined location within the 2D flow area model.
Automatic Culvert Assignment
The software can now automatically assign culvert invert elevations using the underlying terrain model. Alternatively, GIS node or polyline shapefiles can be used to quickly define culverts, automatically assigning invert elevations, culvert types (i.e., circular or box), diameters, and more. This is particularly useful when working with large data sets where workflow automation can greatly speed-up model creation.
Perform Analysis Hotkey
To speed up workflow when quickly iterating changes to a model, the user can press function key F12 and the HEC-RAS simulation will automatically startup and run. There is no need for the user to manually select the Perform Analysis command from the ribbon menu.
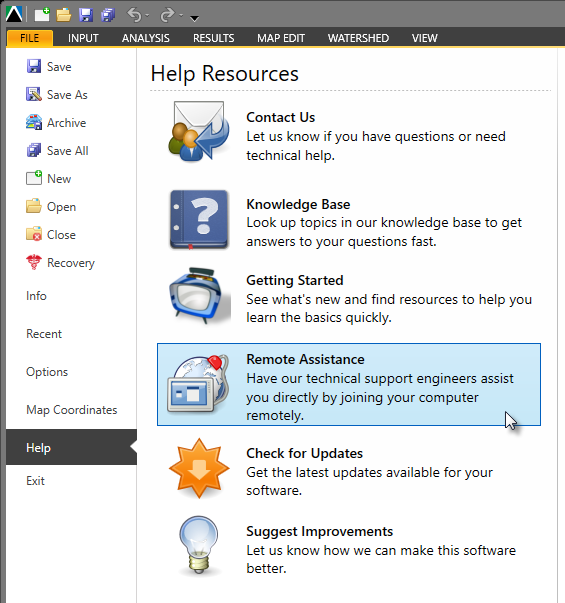
Built-in Remote Assistance
To better assist our users, the software offers the ability to request that our technical support engineers remotely connect to your computer workstation to provide technical support help. From the Help backstage page, click on the [Remote Assistance] button. The software will provide you with a 9-digit code that you can provide our technical support engineers, giving them limited access to your computer to assist you. (Note that our support engineers cannot remotely access your computer without your explicit request and permission. Your privacy and security are guaranteed.)
Network Deployment and Licensing
The installation program can now remotely and silently deploy the software and license across a computer network to any number of computers within minutes. This greatly speeds-up IT administration for the installation and licensing of the software. This Knowledge Base article explains the process to remotely deploy the software and license across a computer network.
What’s Updated
Large Model Support
Database architecture has been redesigned to support extremely large models, reducing load time and enhancing software performance.
2D Mesh Generation Optimization
Speed improvements and optimizations have been incorporated into the mesh generator, allowing larger 2D meshes to be created in much less time.
2D Mesh Error Auto Fix Optimization
Automatic correction of 2D mesh bad elements has been enhanced, providing improved speed and support for more bad element types. The correcting of 2D mesh errors is significantly faster and the correction of more complicated mesh error situations is supported.
Assign Conveyance Obstructions
The Assign Conveyance Obstructions command has been improved, allowing the user to select specific cross sections to apply the conveyance obstructions to.
Assign Ineffective Flow Areas
The Assign Ineffective Flow Areas command has been improved, allowing the user to select specific cross sections to apply the ineffective flow areas to.
Animation Display Improvements
Display of 1D and 2D flood map animations has been improved so that the display updates nearly instantaneously while the user is zooming and panning about the model.
Improved Project Archiving
The software now always compresses the archive (ZIP) file using the maximum compression method. However, the user can now select to include or exclude the analysis results in the archive file.
Improved Zoom To Command
The Zoom To command has been enhanced to support zooming to 2D cells, 2D cell faces, and 2D cell points within a 2D flow area. This can be useful when troubleshooting a complex 2D flow model. For example, this command can be used to zoom to a problematic 2D flow element that is having convergence issues during a simulation. Examining the 2D cells in the region can provide insight on how to correct the problem.
Improved Profile Line Plots
Profile line plots have been improved, providing support for 1D, 2D, steady flow, and unsteady flow models. The user can select the corresponding scenario (i.e., plan) and time-step (for unsteady flow models). The minimum and maximum results can be plotted for unsteady flow models. In addition, the user can compare multiple profile line plots.
For 2D flow models, the software offers the option to use the defined profile line as a breakline so that the computed flux through the profile line is following exactly along the defined line and not along the nearby cell faces.

Improved Time Series Plots
Flow and stage hydrograph plots and velocity plots can be displayed for any location on a 1D or 2D flow area to visualize the time variance of a flood. Additional capabilities have been added to the time series plots, allowing the user to compare multiple time series plots, as well as select different variables to plot.
Additional Graphical Output Commands
The user can right-click on nearly every HEC-RAS entity and choose to display the analysis results from the displayed context menu. Graphical output is available from the right-click context menu for the following entities:
- River Reaches
- Cross Sections
- Roadway Crossings
- Inline Structures
- Lateral Structures
- SA/2D Connections
- SA/2D Boundary Condition Lines
Improved CAD Drawing Layers dialog box
The CAD Drawing Layers dialog box has been resized to show more AutoCAD layers (MicroStation levels) at one time, and to support longer layer names.

Improved CAD Properties dialog box
The CAD Properties dialog box has been improved, allowing the user more control over externally referenced drawing files. The File References panel shows all the externally referenced files contained in the main file, and the hierarchy of files referenced in other files. In addition, the panel shows the status of each externally referenced drawing file, whether it is loaded, not loaded, or not found. The user has total control of updating external references that might be broken, unloading externally referenced drawing files that might be currently loaded, as well as loading externally referenced drawing files that might not be loaded.

Improved Installation Program
The installation process has been improved by making the installation software self-contained. This makes installing the software more seamless—especially in a network environment.
Cross Section Geometry Extraction Optimized
Cross section generation has been improved, decreasing the time required to extract geometry from a terrain surface.
Extract Roadway Geometry Command
When extracting roadway geometry (high chord) elevation data, the user can choose to either use elevation data along the roadway centerline or along the roadway edge.

Auto-Aligning Copied Roadway Crossings / Inline Structures
When copying a roadway crossing or inline structure, the software will automatically align the structure perpendicular to the river reach.
Improved Meshing for 2D Flow Area Connection Weirs
The software will automatically create a breakline at a 2D flow area connection weir so that the weir geometry is aligned with the mesh.
2D Flow Area Roughness Regions Color Support
Separate color assignment is provided for each 2D flow area roughness region, allowing the user to more easily distinguish between several different roughness regions.
2D Land Cover Legend Optimized
The 2D land cover legend, displayed on the Map View and Map Data Layers panel, has been optimized. The legend now lists only those land cover types that exist on the Map View. Extraneous land cover types that are not shown on the Map View are no longer displayed in the legend.
LIDAR Version 1.4 Support
The LIDAR processing library has been updated to support the latest LAS and LAZ version 1.4 format.
Roughness Regions Color Support
When creating roughness regions in a 2D flow model, the software will automatically assign a unique color to each region. The user can change the defined color if desired.
Improved Lateral Structure Stationing
When dealing with complex river systems the software is much more capable of automatically computing the lateral structure river station. The lateral structure river station now matches the river stationing of the adjoining cross sections.
Improved Renaming of River Reaches
While renaming a river reach from the Map View, the user can select an existing river name from a pulldown combo box which lists all the river names contained in the model. Alternatively, the user can create a new river name.
FEMA NFHL WMS Support
Support for the new FEMA NFHL (National Flood Hazard Layer) WMS (Web Map Service) has been updated.
Imported HEC-RAS Models Directory Paths & File Names
When importing a HEC-RAS model into a new (blank) GeoHECRAS project, the software will automatically name the GeoHECRAS project the same as the imported HEC-RAS model and use the original HEC-RAS project directory as the GeoHECRAS project path.
What’s Fixed
US / Metric Units Default Dimension Support
For 2D models, the software now correctly manages the default values for cell dimensions and breakline cell spacing.
Color Fill Decimal Precision
Definition of color fill in the Properties dialog boxes now supports decimal point precision. This is useful when plotting certain types of data, such as velocity and shear stress, on the Map View.
Inline Structure Rating Curve
The water surface elevation versus diverted flow rating curve data is now correctly passed to the HEC-RAS engine.
Storage Area Data Units
The unit label displayed for metric (SI) units for storage area in the Storage Area Data dialog box now displays correctly.
Find more information on our Knowledge Base or join the conversation about GeoHECRAS. Follow us on Facebook, Twitter, LinkedIn, and Google+ using #GeoHECRAS, #ReadyToEngineer.