

Experiments in Flood Risk Assessment
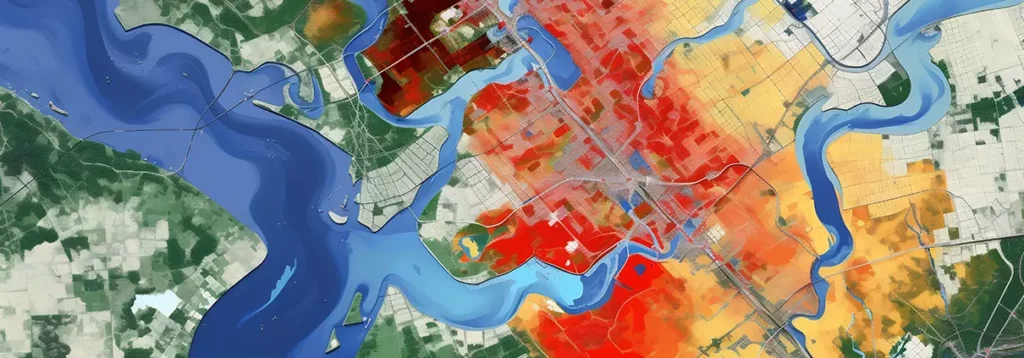
As cities grapple with flood preparedness, a strategy known as “stochastic storm transposition” (SST) is increasingly viewed as a tool useful for flood risk assessment. Today, the method is principally used by U.S. federal agencies managing large critical infrastructure. The methodology makes use of high-resolution gridded radar data of recent storm events to mathematically generate thousands of other plausible and realistic storms. The results—combined with the output of a rainfall/runoff model—provides a detailed picture of how extreme storms could affect flood risk in a targeted area.
SST requires significant computational power, which is partly why it is still not widely used; however, these circumstances could easily change. In a few years, state and local agencies could be leveraging this methodology more frequently for planning purposes, particularly as computational efficiencies grow, and the use of meteorological data grows with it.
Developing a more complete storm picture
Simple statistics and minimal field measurements have supported engineers for decades and continue to be important in the design of infrastructure. As we know, flood frequency analysis (FFA) and intensity-duration-frequency (IDF) curves are based on observations recorded at rain gauges and stream gauges. These field measurements are fitted to parametric probability distributions to identify peak flows, an approach that has allowed engineers to infer flows of variable return periods using minimal data inputs and basic statistical tools. Most importantly, these methods were more than adequate for planning and design purposes so long as historic IDF curves remained reliable indicators of future rain events.
Hydrologists advocating for the use of SST point out that the use of FFA and IDF results in an overly simplistic picture of a storm’s impacts on a watershed. Conventional design approaches don’t track a storm’s movement over changing terrain or other aspects of a storm’s “structure” as it affects a specific area. The SST methodology captures this variability by using real storm data to generate thousands of plausible storms, all of which provide key detail on important storm/land interactions within the watershed.
How SST works
High-resolution gridded radar datasets for a meteorologically homogeneous region are the “powerhouse” behind SST methodology. These data provide detail about how storms behave within the area of interest. The larger and longer the record of storm data for that region, the greater the ability to identify potentially thousands of distinct storm events, each with unique characteristics relating to intensity, orientation, and movement through the watershed.
Once a collection of storms is identified, a computer program randomly samples subsets of the storm data to generate additional physically plausible ensembles of storms. These storms can then be mathematically moved or “transposed” to different locations within the watershed to show rain trends over space and time. As a result of this process, the engineer has a larger and longer dataset from which to understand what could happen in the specified location under a range of extreme conditions.
In a study involving the Arkansas River Watershed near Pueblo, Colorado, England, and other researchers concluded that using SST expanded an otherwise data-poor stream gauge record by tapping into a meteorologically solid storm catalog. When SST data were combined with a rainfall-runoff model, it became clear that storm size and location in the watershed clearly impacted flood peaks, a detail the authors claim would have been missed with standard design-storm protocols. It is worth asking the question: If a detailed SST analysis of extreme flood risk had been performed for the Guadalupe River Basin in the Hill Country of Texas, could lives have been saved?
SST Use in the U.S.
The federal Bureau of Reclamation is using its open-source SST platform known as RainyDay—developed by civil engineering Professor Daniel Wright at the University of Wisconsin-Madison—in several basins for the purpose of dam and reservoir flood hazard analysis. The tool is increasingly viewed as an effective way to assess system performance when tested against the large ensemble of plausible storms SST generates. The U.S. Army Corps of Engineers is also experimenting with integrating SST into HEC-HMS to develop watershed averaged precipitation-frequency curves and identify locations susceptible to extreme flood flows.
SST is still experimental and requires significant computational power, but it is increasingly considered a solid planning tool by agencies charged with designing for extreme risk. Most importantly, the methodology depends on robust gridded storm data, ideally spanning decades. This data-centric aspect of SST means that earlier risk assessments can be reevaluated as new data become available. This is not exactly a real-time data input, but it is close. As this tool evolves and becomes more accessible to local agencies, it could offer an advantage as shifting precipitation trends and general climate uncertainty places a premium on agility, timely adaptation, and resilient design.

 EN
EN  FR
FR  DE
DE  IT
IT  ES
ES  CN
CN  PL
PL  ID
ID