GeoHECRAS Update: HEC-RAS Workflow Automation

Nov 5, 2015 Release
For this release of GeoHECRAS, after getting lots of feedback from our users, we have introduced several major new features that improve and speedup the workflow of the HEC-RAS modeler. For example, the software will automatically build the bridge opening after you provide it just a few parameters defining the opening geometry. In addition, as you resize a new bridge design, the software will instantly compare the hydraulics of the new bridge opening with that of the original bridge opening. Change a dimension and the software instantly tells you how the new bridge compares with the old one.
To speed up FEMA floodplain modeling workflow, the user can now download the published FEMA flood map as shapefiles onto the computer. Then, the Assign Floodway Stations command will instantly map the published FEMA floodplain encroachment stations to the HEC-RAS model cross sections as a method #1 floodplain encroachment, quickly setting up the FEMA duplicate effective model.
There are several other workflow enhancements that have included in this update. Have a look!
What’s New
Water Surface Plotted in Cross Section Data Dialog Box
The user can now specify that the energy grade line, water surface, and critical water surface be plotted in the cross section plot within the Cross Section Data dialog box and the roadway crossing plot within the Bridge & Culvert Data dialog box.

Build Bridge Opening
To speed up the creation and editing of bridge openings, the software can automatically construct the bridge opening by defining the basic dimensions and parameters for the opening. For example, the bridge opening can be defined by specifying a bridge span and a corresponding left abutment station, center station, or right abutment station, or by specifying a bridge abutment left and right station.

Bridge & Culvert Comparison Analysis
The software will display an analysis results comparison between a proposed and existing bridge or culvert structure, showing the computed energy grade elevation, water surface elevation, velocity, and flow area for the opening structure and for several upstream cross sections. The user can interactively adjust the proposed bridge or culvert design for the roadway crossing and the software will automatically update the comparison results.

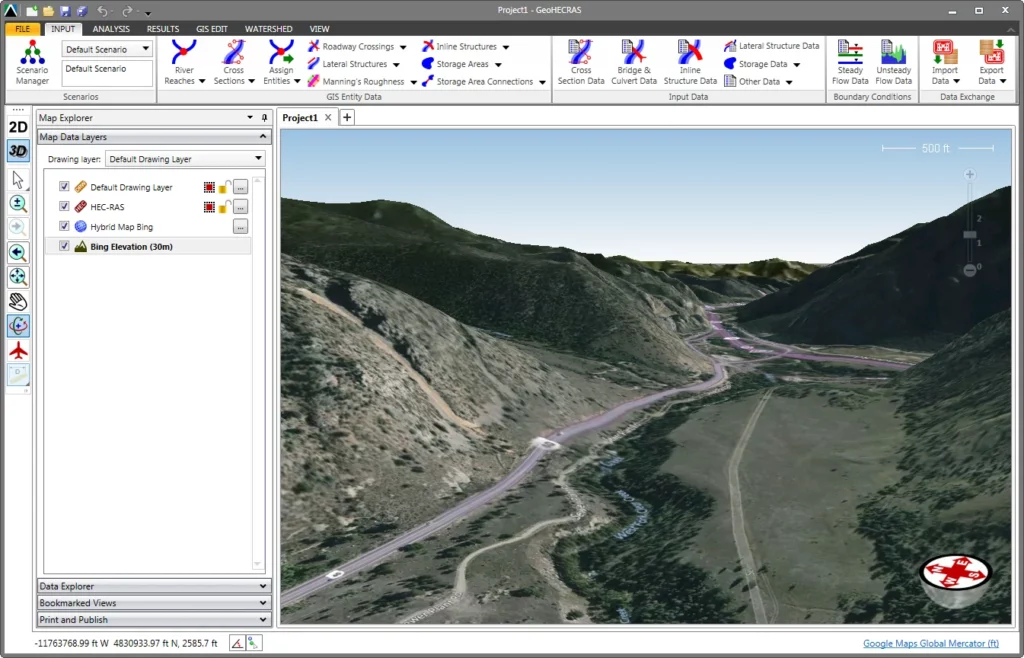
Realistic 3D Rendering of Roadway Crossings
Near photorealistic real-time 3D rendering of roadway crossings, inline structures, and lateral structures are now constructed. Changing dimensions, culvert spacing, and elevations automatically updates the rendered structure. This allows the user to easily interact with, maneuver around, and change the structure design to gain perspectives impossible to capture in 2D. This improves how the HEC-RAS model is communicated inside and outside of the company. For example, it is simply easier to understand a bridge design when you can see it in 3D—as opposed to a 2D plot.

Online Elevation Data
The software will automatically stream elevation data to your computer for the area that you are working in. For the United States, available elevation resolution is 10 m (elevation grid point every 10 meters). For areas outside of the United States, elevation resolution is 30 m. The software will automatically merge online elevation data with higher resolution elevation data loaded from the local computer. Both US elevation units (ft) and metric elevation units (m) are provided.
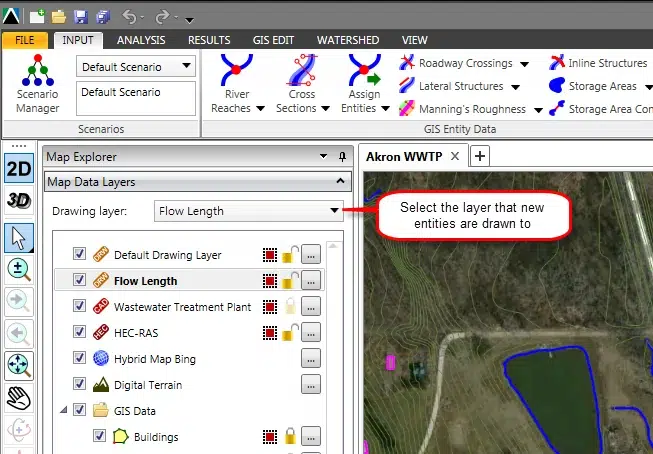
Current Drawing Layer
Within the Map Data Layers panel the user can explicitly select the layer that new entities (other than HEC-RAS entities) are drawn to. This helps the user by “locking” the selected layer for digitizing new entities.
FEMA NFHL Shapefile Download
Download FEMA National Flood Hazard Layer (NFHL) data as shapefiles on to the local computer for a user-specified region. The NFHL provides users with the ability to determine the flood zone, base flood elevation and floodway status for a particular geographic location. It also has National Flood Insurance Program (NFIP) community information, map panel information, cross section and hydraulic structure information, Coastal Barrier Resource System information (if applicable) and base map information, such as road, stream and public land survey data. A full list of available NFHL layers is provided in the download data dialog box.

LIDAR Support
Digital terrain models can be quickly constructed from bare-earth (Light Detection and Ranging) LAS and LAZ formatted LIDAR elevation data files. LIDAR data can often contain millions of points for a given area. The LIDAR elevation processing tools are extremely fast, utilizing multi-core processing for extremely large datasets.
MicroStation Drawing Support
Full support of Bentley MicroStation V8 (import and export) and V7 (import only) DGN drawing files is provided. The import process handles DGN objects and properties that have a direct correlation to DWG objects and properties without any issues. For example, levels in MicroStation translate directly to AutoCAD layers. However, DGN objects and properties that have no direct correlation to DWG objects and properties may not translate completely.
Merge DEMs
This command can be used to merge two or more adjoining and overlapping DEMs (Digital Elevation Model) into a single DEM. This is useful for creating contours, cutting cross sections, or generating a flood map from a single elevation source.

Merge Polylines
This command can be used to merge two or more adjoining polylines into a single polyline. This is useful, for example, when the user has stopped digitizing a long river reach and then started up again later. The user can merge the two river reaches into a single river reach.
HEC-RAS User-Defined Summary Profile Tables
User-defined summary profile tables are now supported. The software will automatically synchronize with any user-defined tables that are defined for the US Army Corps of Engineers HEC-RAS software.
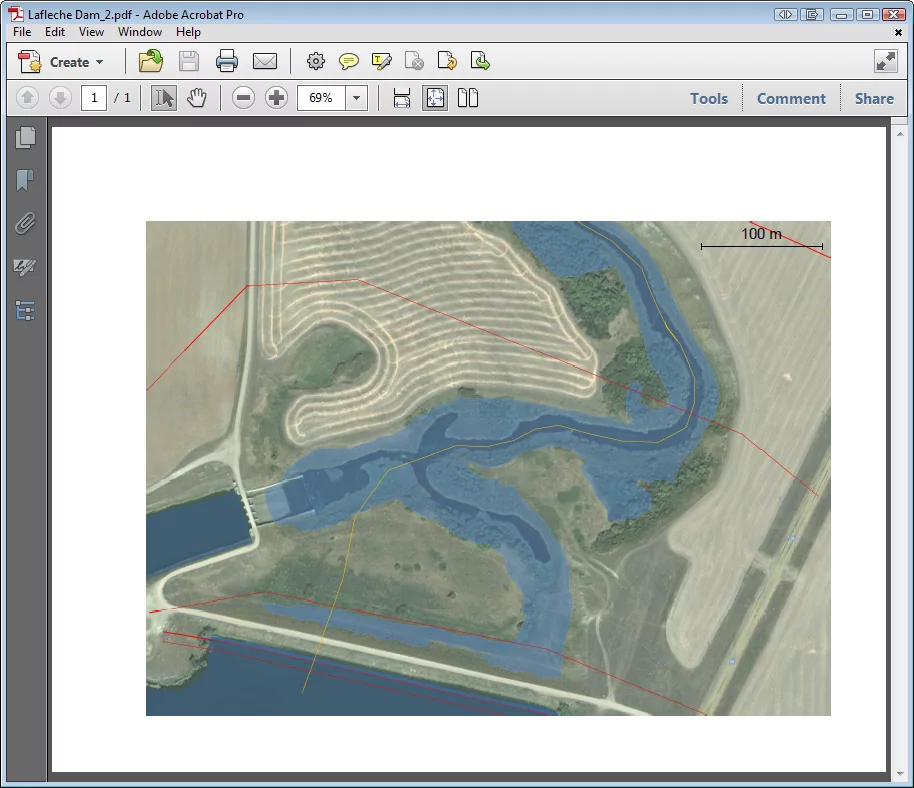
Enhanced Flood Mapping
Several major and minor enhancements have been added to the flood mapping command. The software can now construct an approximate or precise flood map. The precise flood map takes longer to compute than the approximate flood map. The user can specify the clipping boundary limits as well as whether to clip out any building footprints. In addition, river junctions for large river network models are better supported. Finally, for large river models, the user can restrict the flood map to be created for smaller regions so that a detailed flood map can be created.
Incomplete HEC-RAS Model Profile Plots
The software is able to generate a river profile plot without the HEC-RAS model being completed. This allows the user to check that the defined cross section geometry and flow lengths are matching what was entered.
Metadata Tab for WMS Layers
A metadata tab is now provided for most WMS (Web Map Service) layers, which provide details of when the web map was created, the originating data, and contact information for the map data.

Bridge Plot for Hydraulic Parameters
The dialog box used for defining the unsteady flow hydraulic parameters for bridge structures now includes a plot of the bridge opening to assist the user in defining the necessary parameters.

Expansion and Contraction Coefficients Editing
The user can directly edit the expansion and contraction coefficients within a single table for the entire river reach. For example, this allows the user to quickly adjust expansion and contraction coefficients at a roadway crossing.

Flow Length Editing
The user can directly edit the left overbank, channel, and right overbank flow lengths within a single table for the entire river reach.

Data Grid Fill Handles
Data grids now provide a fill handle allowing the user to replicate an entry into the other rows within the data grid, similar to what is provided within Microsoft Excel. For example, the user can easily fill-in the same downstream boundary conditions for all of the defined profiles in the Steady Flow Data dialog box.

Map Layers Selection Locking
The Map Data Layers panel now allows the user to lock a layer from selection. This allows the user to still view the layer, but not be able to click on anything on that layer for selection. This eliminates the problem when there are a lot of elements from various layers displayed in the Map View, and the user wants to select only elements from a single layer.

Toggling of Map Layers While Digitizing
The software now allows the user to toggle various properties of the map layers within the Map Data Layers panel while digitizing. For example, the user can toggle the display of a layer ON or OFF file digitizing a polyline as long as the layer is not the layer being digitized.
Automatic Computing of Junction Flow Lengths
The software now automatically computes the flow distance at a junction between the upstream and downstream river reaches. The user does not need to manually measure the flow length unless the flow traverses a path different than the defined river reach.
Ortho Measure Tool in Cross Section Plot
The software provides an ortho measure tool for measuring distances in the Cross Section, Roadway Crossing, Inline Structure, and the Lateral Structure Plots.
Optional Geometry Extraction for Georeferenced Cross Sections
The software now provides an option to automatically extract the cross section geometry for georeferenced cross sections. In addition, the software will automatically update the flow lengths for the georeferenced cross section and the next upstream cross section.
Improved Display of Cross Section IDs
The software now takes into account the width and height of the cross section ID (river station) on the Map View, and will place the cross section ID slightly offset from the end of the cross section so that the ID does not overwrite the cross section line.
Linked Selection of Cross Section Geometry Points
Selecting a ground point within the Cross Section Plot will also highlight the selected ground point within the Cross Section Data dialog box data table. The same behavior occurs within the Roadway Crossing Plot, Inline Structure Plot, and Lateral Structure Plot, by highlighting the corresponding geometry point within the data table.

Delete Multiple Points in Cross Section Plot
The software allows the user to drag a window to select ground geometry points for deleting within the cross section plot of the Cross Section Data dialog box. The same can be done for roadway and bridge geometry points within the roadway crossing plot of the Bridge & Culvert Data dialog box, weir crest geometry within the inline structure plot of the Inline Structure Data dialog box, and levee weir geometry within the lateral structure plot of the Lateral Structure Data dialog box.

Real-Time Feedback while Measuring Distances and Areas
While measuring distances and areas on the Map View, the software now provides real-time feedback on the distance or area that has been measured. For example, this is helpful when attempting to accurately place a modeling element on the Map View.
Develop HEC-RAS Model from GIS Shapefiles
The software can construct complete HEC-RAS geometry models from external GIS shapefiles. For example, river reaches, cross sections, bank stations, flow lengths, Manning’s roughness, levees and more can be automatically assigned from GIS shapefiles. All the user needs to do is assign flow boundary conditions and the HEC-RAS model is completed.
Automatic Mapping of GIS Attributes
The software will now “guess” at which attribute field should be used based upon the field label name and field type. For example, assigning roughness regions using a GIS polygon shapefile using the Assign Manning’s Roughness command, the software will review all of the attributes contained within the shapefile and select what it thinks is the attribute to be used for assigning roughness to the cross sections.
Summary Profile Output Table User-Defined Locations
The summary profile output tables now allow the user to define specific locations (i.e., cross sections, roadway crossings, inline structures) to include in the output table. In that way, the user can specify only those locations that are of key interest and the software will not display results for any of the other locations.

Extract Cross Section Geometry from 3D Polylines
The software can generate the cross section geometry directly from 3D polylines. For example, 3D polylines from AutoCAD or MicroStation can be used to create the cross section geometry.
Map Scale Bar in Printed Output
The software will now optionally include a map scale bar in the 2D Map View that is printed. Work is going on to implement this same functionality with exported PDF files.
High Chord and Low Chord Drawing
The software allows the user to draw the high chord and low chord geometry on the roadway crossing plot in the Bridge & Culvert Data dialog box.
Double Click Middle Mouse Button to Zoom Extents
Similar to AutoCAD, double-clicking the middle mouse button will cause the software to zoom extents for the current layer or HEC-RAS layer if there is HEC-RAS data defined.
Dynamic Loading of Geodatabases
To improve performance for large GIS geodatabases (i.e., GDB and MDB files), the software will load layers only when they are turned on. In that way, the software does not load the entire database at the time of selection, but only when necessary.
What’s Updated
Improved Display of HEC-RAS Elements
Line weight, styles, and colors are better supported for HEC-RAS elements. Interpolated cross sections are displayed in a different color than user-defined cross sections.
Recutting Cross Sections Automatically Updates Flow Lengths
When recutting a cross section when using the Extract Cross Section Geometry command, the software will now automatically update the flow lengths for the current cross section and the next upstream cross section.
Improved Google Earth Structures
Roadway structures (i.e., bridges and culverts), inline structures, and lateral structures are now shown as 3D renderings within Google Earth.
Automatic Assignment of Colors for GIS Layers
When loading multiple GIS layers at the same time, the software will automatically assign different colors to each layer to allow the user to better distinguish entities from the loaded layers.
Data Explorer Showing Elevations of CAD Elements
The Data Explorer now shows elevations of selected CAD elements.
Terrain Surface Elevation Tracking
The software will now display the elevation of the underlying terrain surface at the cursor location.
Much Faster Digitizing
The previous manual digitizing implementation was slow. The manual digitizing implementation has been completely rewritten and optimized, and is much more responsive to user input.
Base Map Layer Remembered
Displaying the Base Map Layer dialog box shows the currently loaded base map (i.e., Google Aerial, Microsoft Bing Aerial, etc.).
Point Data Descriptions
Importing of survey point file data now carries along any defined point descriptions. Clicking on a point on the Map View will display the point description in the Data Explorer.
Exporting of 3D Point Data
Exporting a HEC-RAS model to AutoCAD, MicroStation, or GIS Shapefiles, the software will include 3D points that represent the cross section geometry vertices.
Deleting of Data Rows
Deleting of rows within the data tables caused the entire data table to reload, causing the data table to scroll to the top of the data. Now deleting of rows within the data tables does not scroll the data table. This allows the user to continue on from the current row in the data table.
Copy Cross Section Command
Duplicated cross sections are now aligned parallel with the adjacent (original) cross section rather than aligned perpendicular with the river reach. If the copied cross section is not placed adjacent to the original cross section, then the software aligns the cross section perpendicular to the river reach.
Cross Section Cutting
Cross section extraction from elevation grid data now allows both adaptive elevation resolution and fixed elevation resolution. Adaptive elevation resolution speeds up cross section cutting when working with elevation grids and will adjust the resolution at which the cross section geometry is extracted at. For example, for very flat terrain the cross section geometry resolution is set to 0.1 ft. For hilly terrain with lots of elevation change, the cross section geometry elevation resolution varies up to 0.5 ft. Fixed elevation resolution allows the user to specify the actual resolution at which the cross section geometry is to be extracted at, down to 0.01 ft (0.003 m).
Improved Toolbar Selection
Selection of multi-tools from the toolbar is improved.
Assign Levees Command
Additional options have been provided for mapping levees to cross sections from the Map View. For example, the user can specify that the levees be placed at a fixed height above the ground terrain or draped onto the ground terrain.
Version Number Added to Application Splash Screen
The version number and build date are now added to the application’s startup splash screen.
Support for AutoCAD MTEXT
Display of AutoCAD MTEXT (Multiline Text) is supported.
Removal of AutoCAD Text Insertion Point
Display of AutoCAD annotation text also showed the text insertion point. This text insertion point is no longer displayed.
Improved Data Recovery Dialog Box
The user experience in recovering a crashed model has been greatly improved.
Improved Video Recording
When starting a video recording using the Print & Publish feature, a countdown dialog box is displayed to alert the user when the video recording is to start. Also, the user can stop the video recording by pressing Function Key F10 (same keypress as used in TechSmith’s Camtasia video recording software).
Project Archiving
Archiving a project now causes the software to first save the project before it is archived.
Improved Bridge and Pier Skew Measurement
The user interaction for measuring bridge skew and pier skew from the Map View has been improved.
Cross Section Data Dialog Box Size
The Cross Section Data and Bridge & Culvert Data dialog box horizontal size was not always computed correctly. This has been fixed. In addition, the user can resize the dialog box by grabbing the right side of the dialog box where the corresponding plot is and can make the dialog box wider or narrower.
Closing of HEC-RAS Output Result Tables
The software no longer automatically closes the Detailed Output and Summary Output HEC-RAS result tables. This allows the user to interact with these dialog boxes while adjusting the input data for the model.
Manning’s Roughness Lookup Table
The Edit Manning’s Data dialog box now has a lookup table for selecting Manning’s roughness values.
Exported HEC-RAS Shapefile Attributes
Additional HEC-RAS input and output data are included as attribute data for exported HEC-RAS model shapefiles.
Folder Selection Dialog Box
The dialog box used to select a folder for placing files, like for storing shapefiles, has been greatly improved.
Defining Default Roughness Values
The Assign Manning’s Data dialog box now allows the user to define a default Manning’s roughness for the left overbank, channel, and right overbank areas.
Profiles Increased to 100
The number of computed water surface profiles that can be defined has been increased to 100 to provide better support for the Modified Puls routing method.
Elevation Grid Layer Name
When using ESRI elevation grids, the software now uses the parent directory name for the layer name.
What’s Fixed
Find more information on our Knowledge Base or join the conversation about GeoHECRAS. Follow us on Facebook, Twitter, LinkedIn, and Google+ using #GeoHECRAS, #ReadyToEngineer.
Snapping to AutoCAD Entities
Sometimes while digitizing river reaches, the software would accidentally snap to an AutoCAD entity and then terminate the digitizing command.
Base Map Transparency
The displayed Base Map was not supporting transparency levels.
HEC-RAS Storage Areas Transparency
HEC-RAS storage areas were not supporting transparency levels.
Not Storing Flood Map Transparency Level
The generated flood map was not saving the defined transparency level.
Inline Structures Not Exported to Google Earth
The software failed to export defined inline structures to Google Earth.
Draping of Computed Water Surface Contours in Google Earth
Software was incorrectly draping the computed water surface contours in Google Earth. Now they are written out at their computed elevations.
Not Supporting AutoCAD Polylines with Arcs
Previously the software was not supporting AutoCAD polylines with defined arcs (i.e., bulges).
Lateral Structure Plot
The lateral structure plot within the Lateral Structure Data dialog box always used a zero starting elevation. This caused problems for levees and lateral structures that were much higher than zero elevation.
Quad Tree Display Issues
The quad tree used to display the model in 3D had some rendering issues which have been fixed.
Unsteady Flow Computational Options
The Unsteady Flow Computational Options dialog box did not automatically initialize the default values to be used in the unsteady flow computations. This issue caused unsteady flow models to fail to run.
Flood Maps Supporting Islands
Straight line edge of water flood map was not honoring internal islands for parallel river reaches.
Exported Flood Contours
The exported flood contours had too many internal vertices within the polyline. The polyline is now simplified to contain a minimum number of internal vertices.
Duplicate Ground Point at Cross Section Thalweg
The software accidentally created a duplicate ground point at the thalweg for the defined cross section.
Faster Display Options
Some of the dialog boxes that allow the user to change display options were rather slow and not very responsive to user changes. This has been fixed.
Image File Border Display
Loaded image files (i.e., GeoTIFF, Mr.SID, ERDAS, etc.) would always have their border turned on by default. This border is now off by default.
Remove All Button
The [Remove All] button used in the ineffective flow areas and conveyance obstructions panel was not working.
Cross Section Horizontal Stationing
In certain special cases, the software incorrectly computed the horizontal stationing for ground geometry points when extracting cross sections.
CAD Layer Visibility
AutoCAD layer visibility was not honored after loading a drawing file.
US Foot vs International Foot
On April 13, 2015, one of our software developers “discovered” that there were two different separate foot measurements being used for US units:
- US Survey Foot
- International Foot
He took upon himself to merge these two units together so that a “foot is a foot” without conferring with any of the civil engineers on staff. He was unaware that there was a difference—as most civil engineers (i.e., non-land surveyors) probably don’t as well.
Unfortunately, this change was not immediately obvious to our testing team and civil engineers. The difference between an International Foot and a US Survey Foot is very small (2 parts per million, or .0002%). 2 parts per million is insignificant for most relative distances. However for coordinate values in the 100,000’s or 1,000,000’s in map projection-based coordinate systems such as U.S. State Plane, confusing the foot definitions can produce feet of shift because scaling is relative to the coordinate origin.
Map Data Layer Panel Drag and Dropping of Layers
Improved the drag and drop reordering of layers displayed within the Map Data Layer panel.
Assign Manning’s Data Command
Specific situations created issues in assigning Manning’s roughness data from GIS coverage data.
Structure Shifting on Map View
Roadway crossings, inline structures and lateral structures would sometimes shift the location on the Map View after editing the corresponding definition data. This is now prevented.
Improved Importing of Georeferenced HEC-RAS Models
The software provides additional options and control when importing georeferenced HEC-RAS models. This helps in correct alignment of river reaches, cross sections, and structures.
Numerous Bug Fixes and Crashes
Many small bugs and crashes have been fixed.